Fig. 6
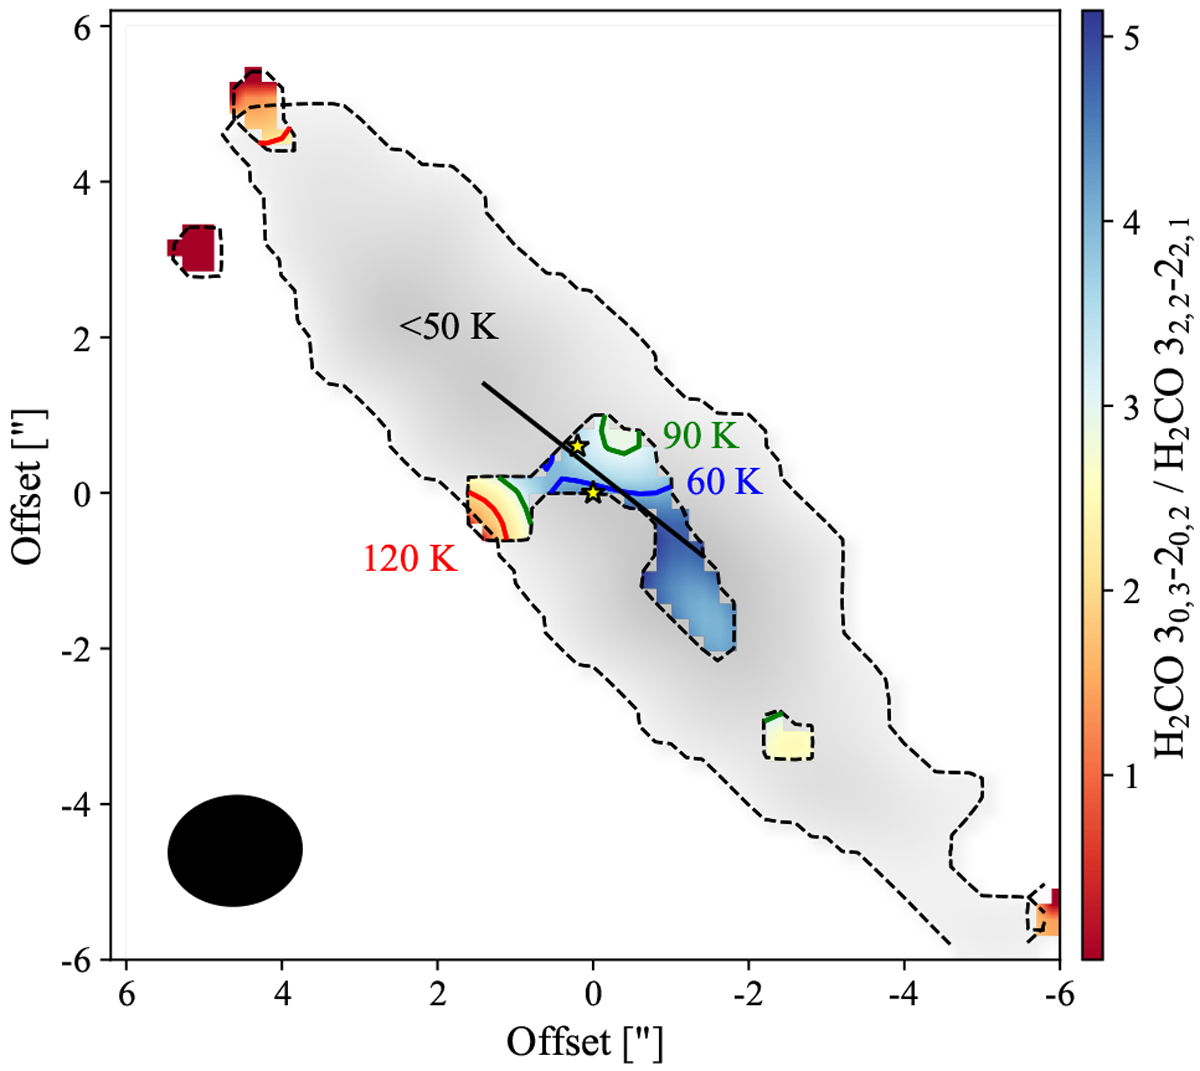
Gas temperature estimation from the ratio between o-H2CO 30,3 − 20,2 and o-H2CO 32,2 − 22,1, following the results from Mangum & Wootten (1993). Specific values of 60, 90, and 120 K are shown by blue, green, and red contours, respectively. The grey region, where o-H2 CO 32,2 − 22,1 is not detected, indicates temperatures below 50 K. The yellow stars show the position of the sources and the solid segment represents the extent of the circumbinary disc. The synthesised beam is represented by a black filled ellipse.
Current usage metrics show cumulative count of Article Views (full-text article views including HTML views, PDF and ePub downloads, according to the available data) and Abstracts Views on Vision4Press platform.
Data correspond to usage on the plateform after 2015. The current usage metrics is available 48-96 hours after online publication and is updated daily on week days.
Initial download of the metrics may take a while.