Fig. 5
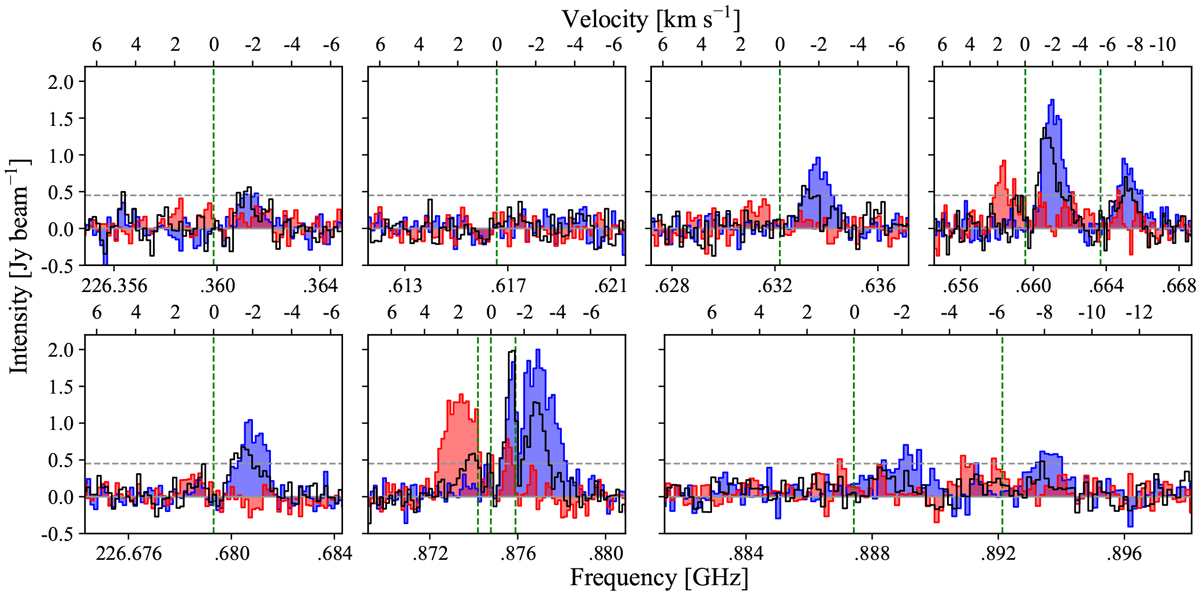
CN spectra taken at three different positions: the geometric centre (black), the southern edge (blue), and the northern edge of the circumbinary disc (red; see white crosses in the moment 0 map of CS in Fig. 2). The dashed green vertical lines represent the rest frequency of the CN hyperfine transitions (see Table 3), while the dashed grey horizontal line shows the value of 3σ.
Current usage metrics show cumulative count of Article Views (full-text article views including HTML views, PDF and ePub downloads, according to the available data) and Abstracts Views on Vision4Press platform.
Data correspond to usage on the plateform after 2015. The current usage metrics is available 48-96 hours after online publication and is updated daily on week days.
Initial download of the metrics may take a while.