Fig. 4
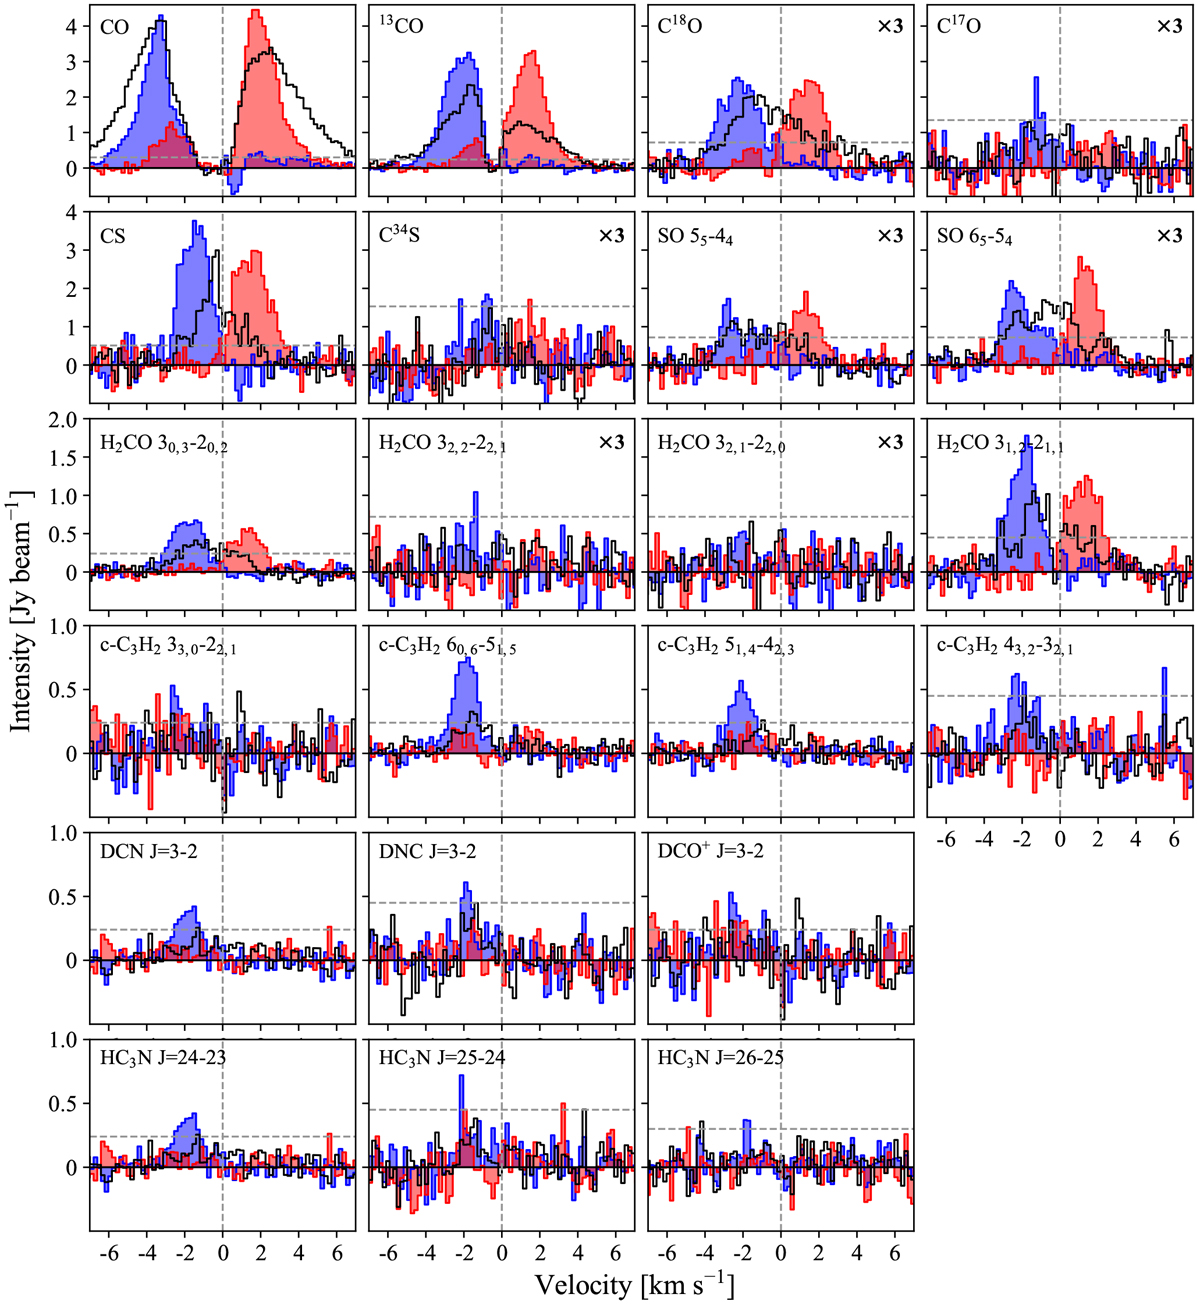
Spectra of the brightest molecular transitions (with the exception of CN) taken at three different positions: the geometric centre (black), the southern edge (blue), and the northern edge of the circumbinary disc (red; see the white crosses in the moment 0 map of CS in Fig. 2). The zero velocity value (dashed grey vertical line) corresponds to a system velocity of 4.2 km s−1. The dashed grey horizontal line shows the value of 3σ (see Table 1). Some of the spectra are multiplied by a factor of three, as indicated in the top right corner.
Current usage metrics show cumulative count of Article Views (full-text article views including HTML views, PDF and ePub downloads, according to the available data) and Abstracts Views on Vision4Press platform.
Data correspond to usage on the plateform after 2015. The current usage metrics is available 48-96 hours after online publication and is updated daily on week days.
Initial download of the metrics may take a while.