Fig. 2
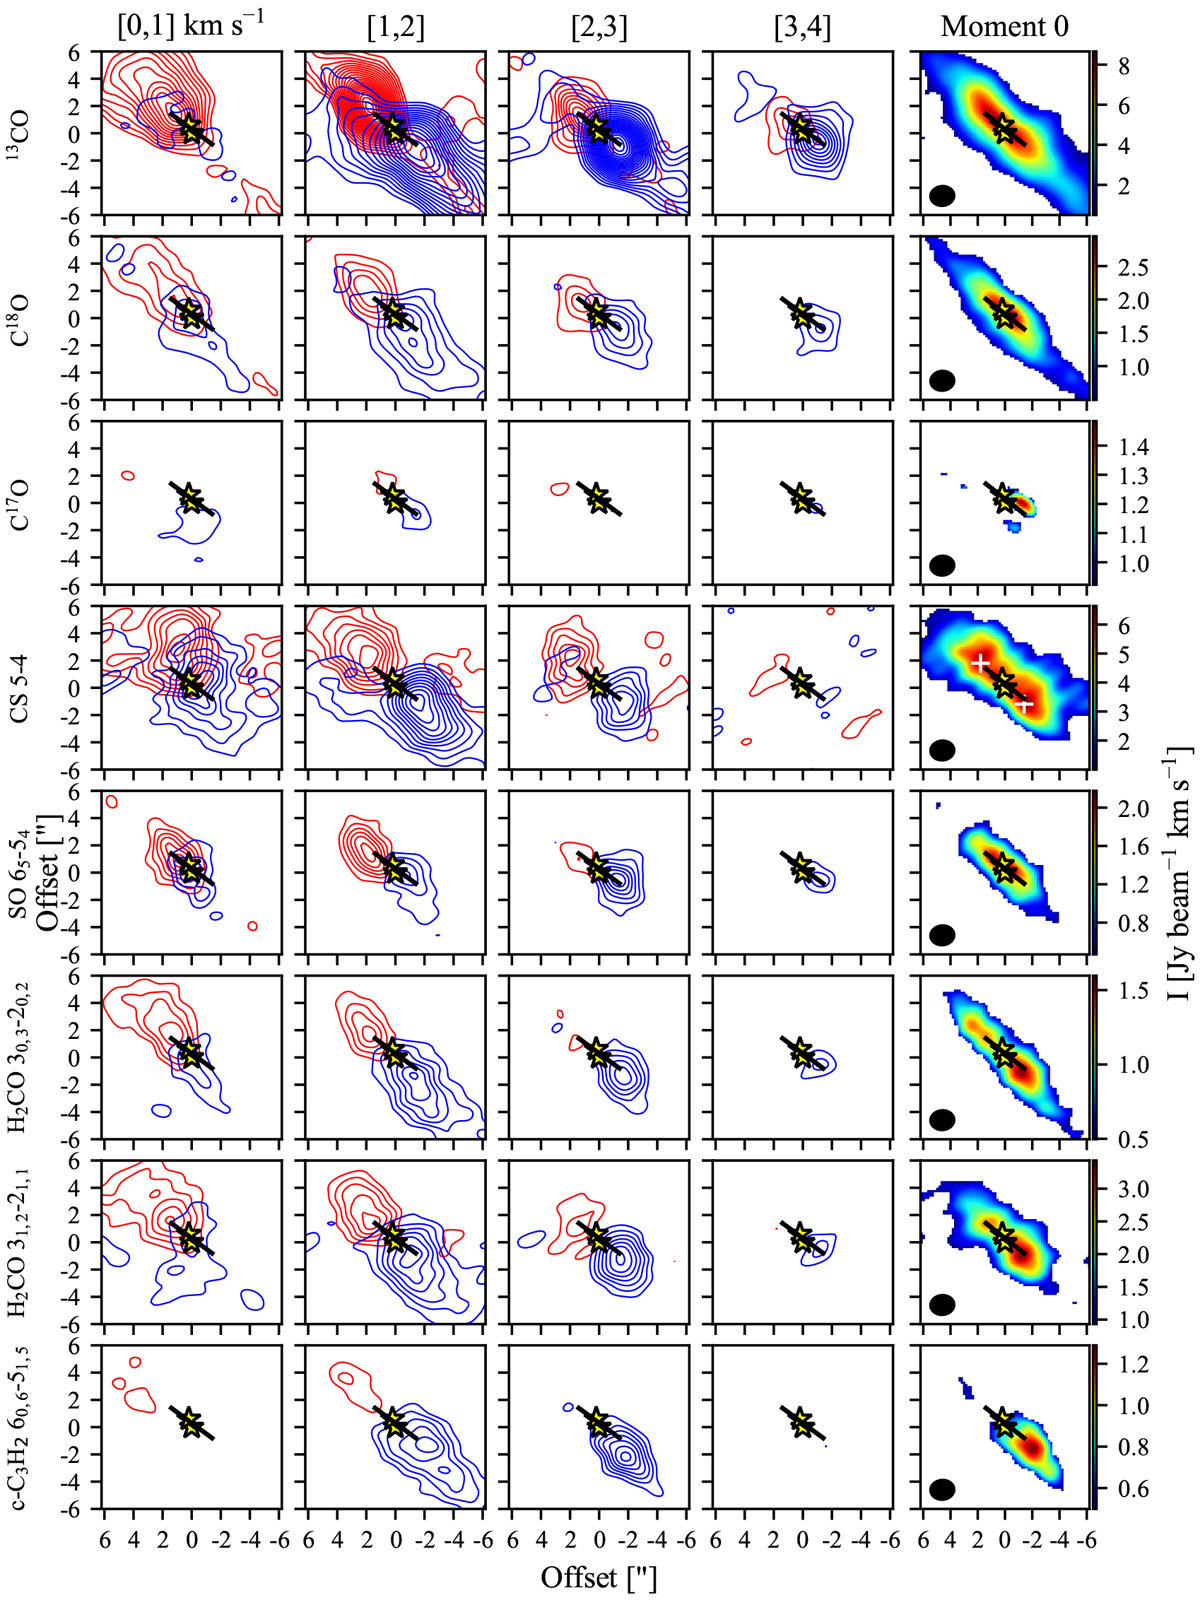
Emission of CO isotopologues and other bright molecular transitions. Channel maps consist of velocity ranges of 1 km s−1 and moment 0 maps are integrated over a velocity range of 8 km s−1. The contours start at 5σ and follow a step of 5σ for 13 CO, C18 O, and CS (the remaining follow a step of 3σ). The two white crosses in the CS moment 0 map indicate the position from which the spectra from Figs. 4and 5 are extracted. The yellow stars show the position of the sources and the solid segment represents the extent of the circumbinary disc. The synthesised beam is represented by a solid black ellipse in the right panels.
Current usage metrics show cumulative count of Article Views (full-text article views including HTML views, PDF and ePub downloads, according to the available data) and Abstracts Views on Vision4Press platform.
Data correspond to usage on the plateform after 2015. The current usage metrics is available 48-96 hours after online publication and is updated daily on week days.
Initial download of the metrics may take a while.