Free Access
Fig. C.1
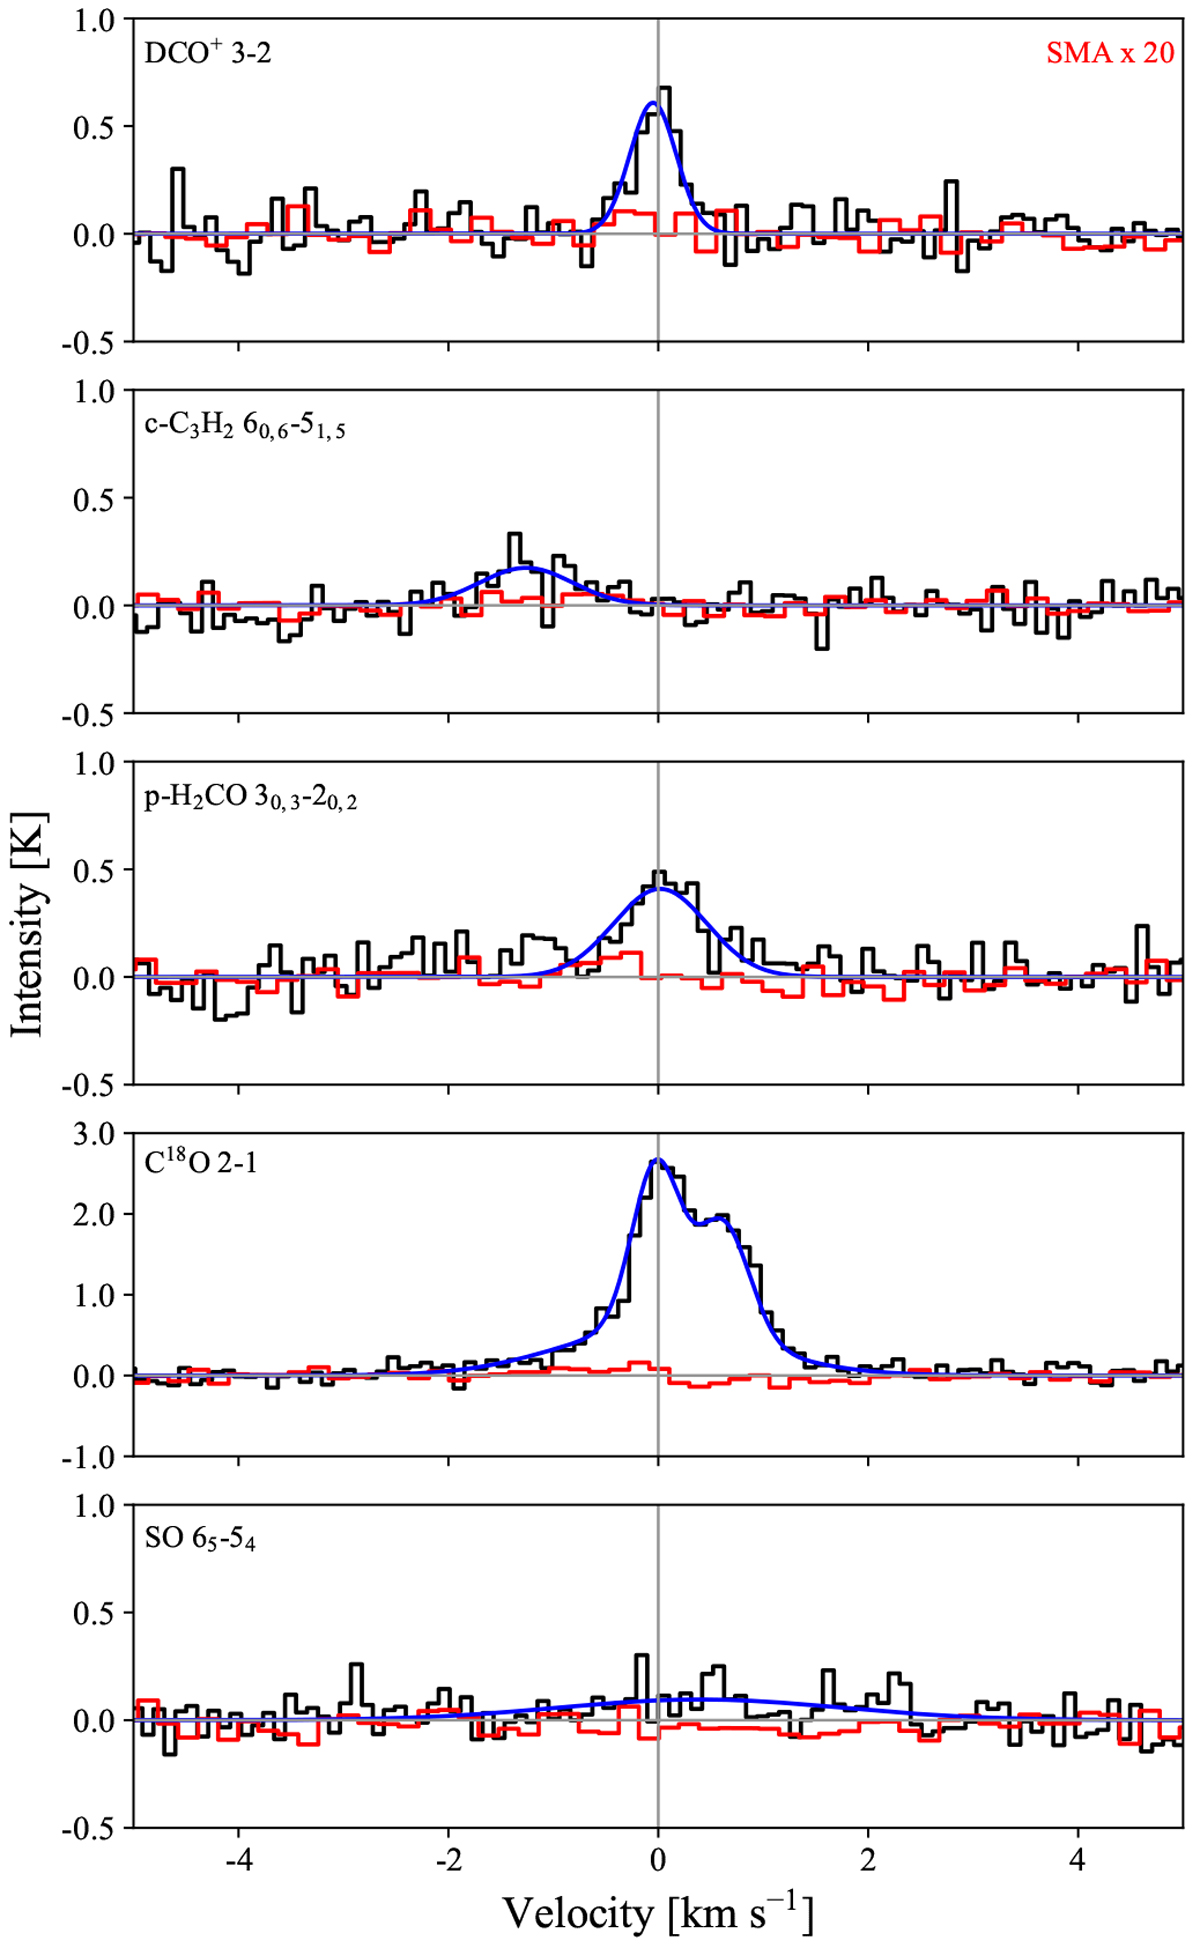
Spectra from APEX data (black) and convolved SMA data with a 29′′ beam (red). For clarity, the SMA spectra are scaled with a factor of 20. The blue curve represents a Gaussian fit and, for C18 O, the curve shows the sum of three Gaussian components.
Current usage metrics show cumulative count of Article Views (full-text article views including HTML views, PDF and ePub downloads, according to the available data) and Abstracts Views on Vision4Press platform.
Data correspond to usage on the plateform after 2015. The current usage metrics is available 48-96 hours after online publication and is updated daily on week days.
Initial download of the metrics may take a while.