Fig. 1
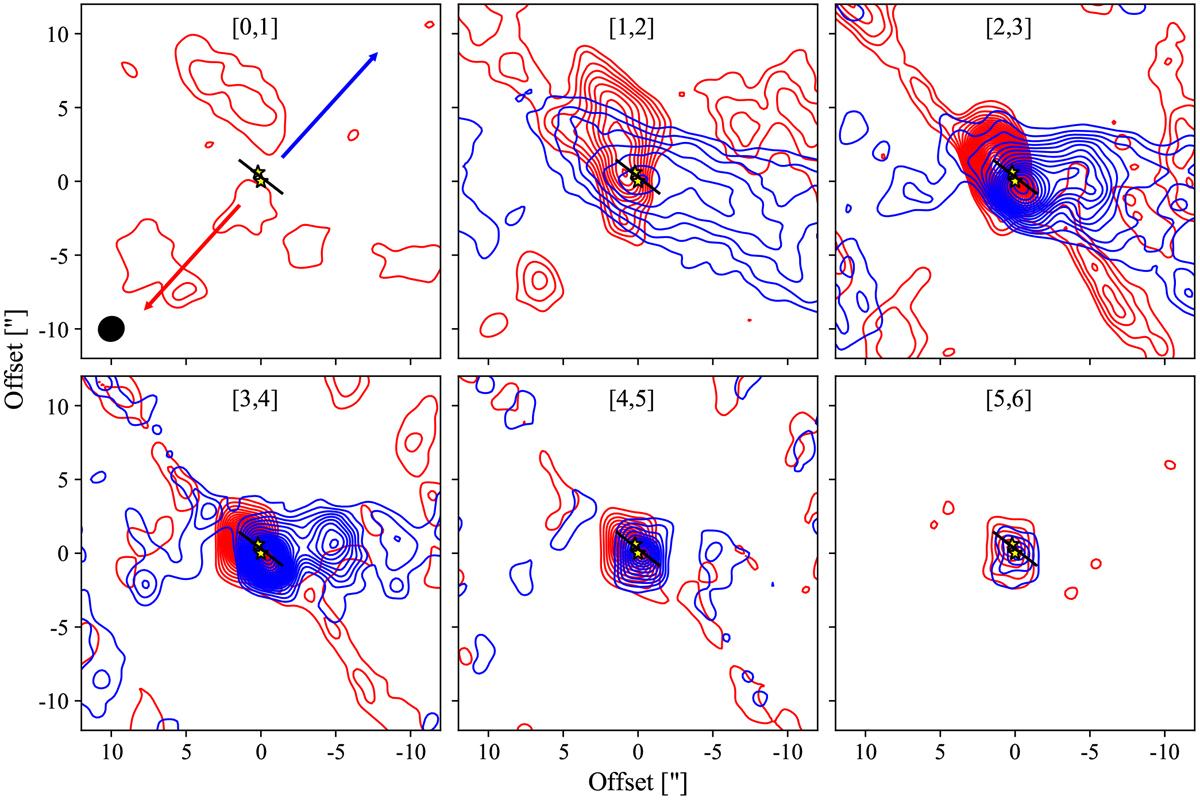
CO emission above 5σ (σ = 0.04 Jy beam−1 km s−1). The contours start at 5σ and follow a step of 5σ. The numbers in brackets indicate the velocity interval in units of km s−1 and the extent of the circumbinary disc is represented by the black solid segment. The yellow stars show the position of the sources. The synthesised beam and the outflow direction from Bontemps et al. (1996) are represented in the upper-left panel with a black filled ellipse and blue and red arrows, respectively.
Current usage metrics show cumulative count of Article Views (full-text article views including HTML views, PDF and ePub downloads, according to the available data) and Abstracts Views on Vision4Press platform.
Data correspond to usage on the plateform after 2015. The current usage metrics is available 48-96 hours after online publication and is updated daily on week days.
Initial download of the metrics may take a while.