Fig. 4.
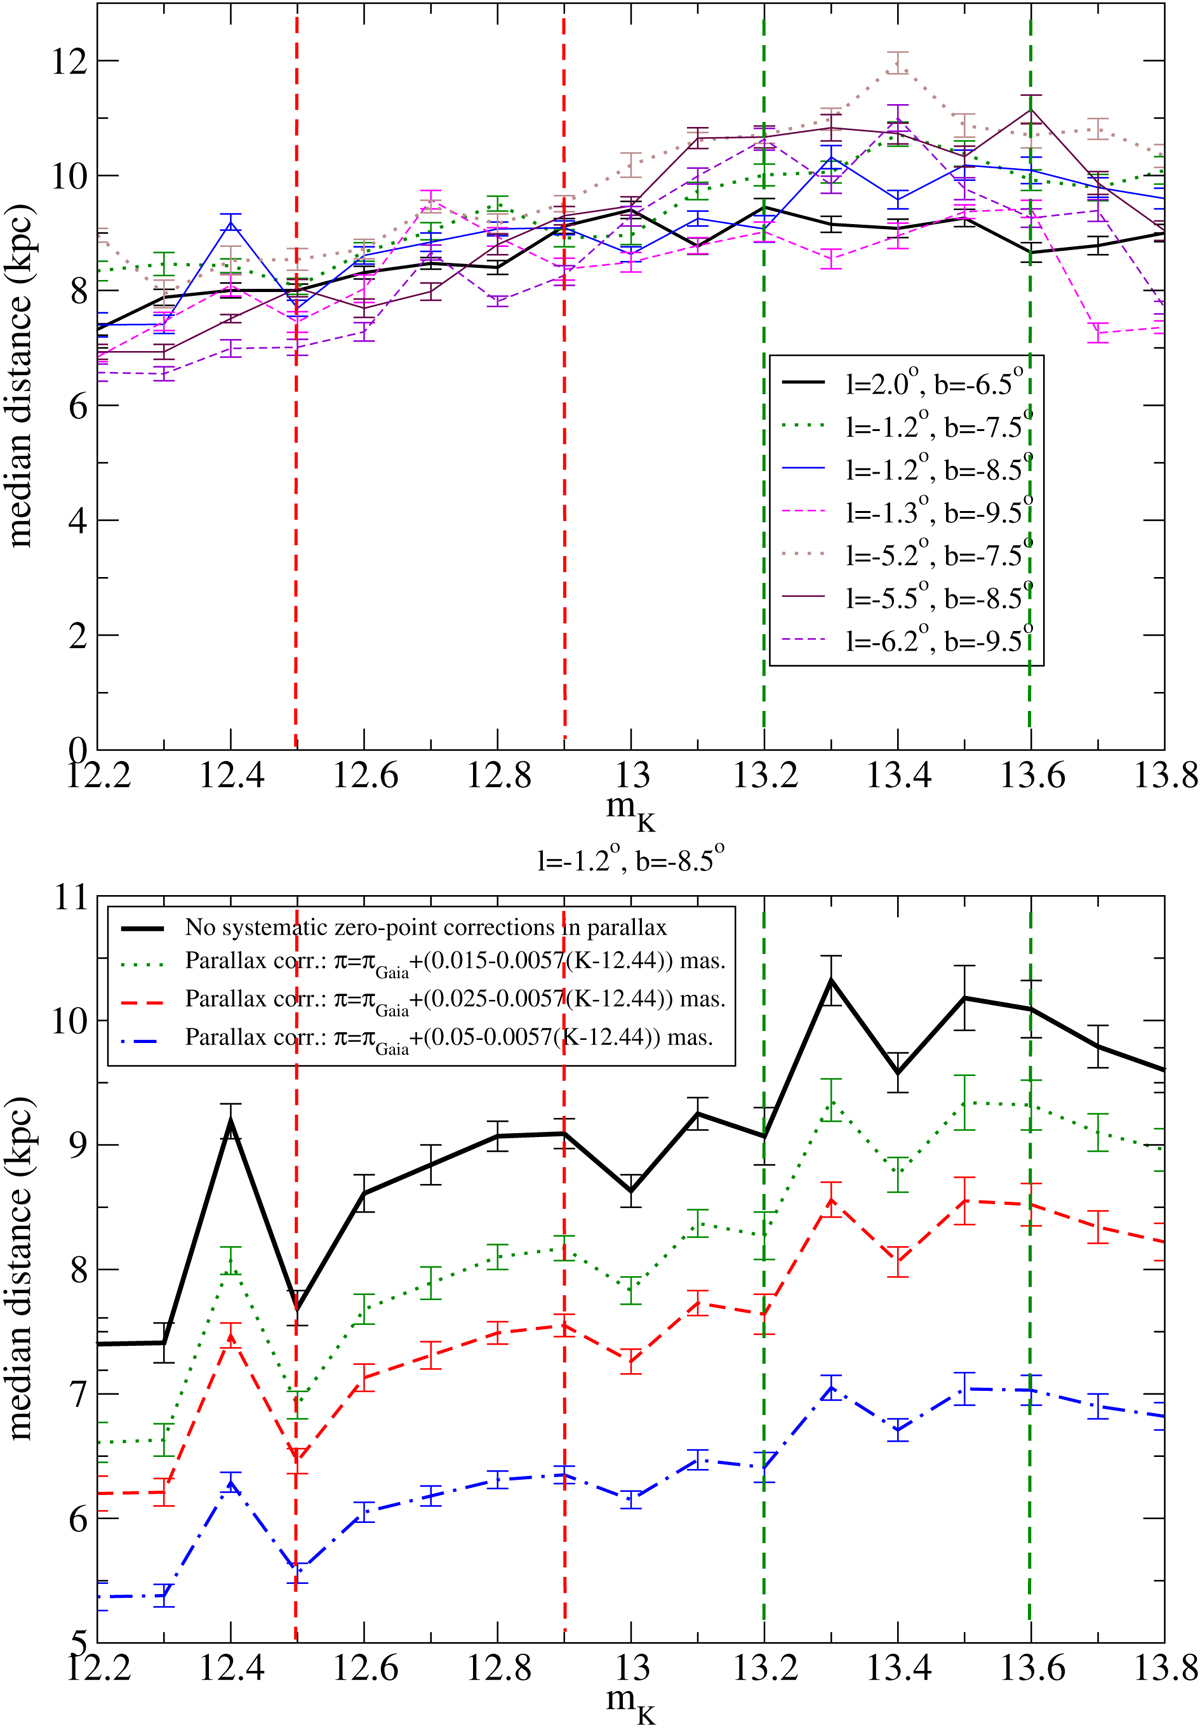
Median distances of RCGs as a function of apparent magnitude. Top panel: median of distances of the selected stars without zero-point systematic correction of parallaxes. The error bars in that plot represent the error of the average (![]() ). The peak of bright RCGs is between the two red dashed vertical lines. The peak of faint RCGs is between the two green dashed vertical lines. Bottom panel: same distance for one line of sight with a zero-point systematic correction of parallax according to Eq. (4) for Δπ(G = 15) = 0.015, 0.025 and 0.050 mas, respectively.
). The peak of bright RCGs is between the two red dashed vertical lines. The peak of faint RCGs is between the two green dashed vertical lines. Bottom panel: same distance for one line of sight with a zero-point systematic correction of parallax according to Eq. (4) for Δπ(G = 15) = 0.015, 0.025 and 0.050 mas, respectively.
Current usage metrics show cumulative count of Article Views (full-text article views including HTML views, PDF and ePub downloads, according to the available data) and Abstracts Views on Vision4Press platform.
Data correspond to usage on the plateform after 2015. The current usage metrics is available 48-96 hours after online publication and is updated daily on week days.
Initial download of the metrics may take a while.