Fig. 1.
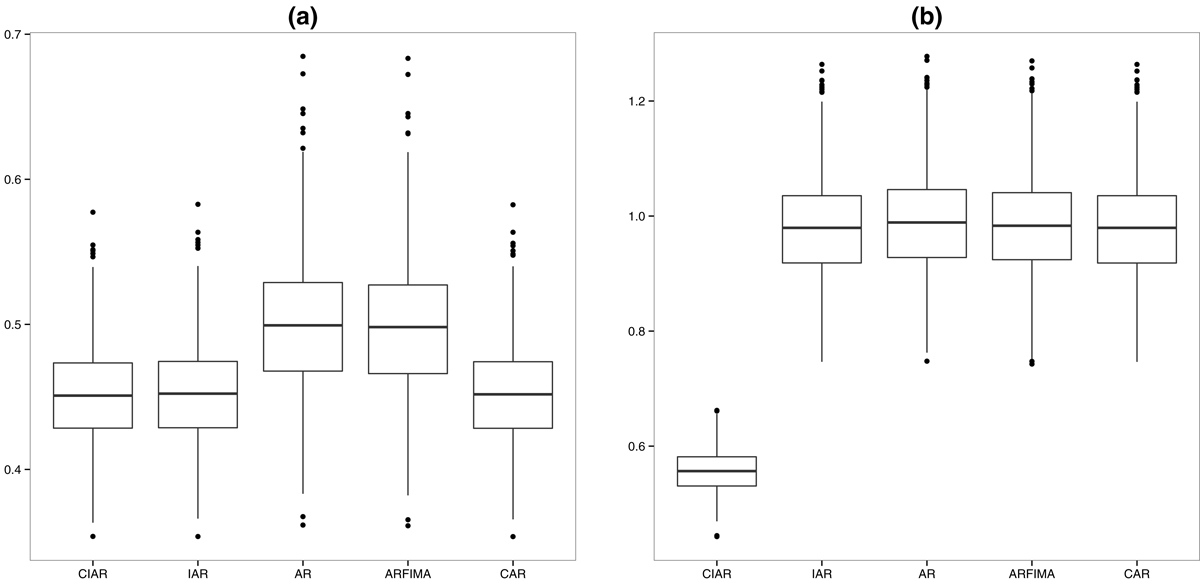
Boxplot of the root mean squared error computed for the fitted models on the 1000 sequences simulated of the real part of the CIAR process. In panel a, each CIAR process was generated using ϕR = 0.99. In panel b, each CIAR process was generated using ϕR = −0.99. The other parameters of the models are defined as ϕI = 0, c = 0 and length n = 300. The observational times are generated using a mixture of Exponential distribution with λ1 = 15 and λ2 = 2, ω1 = 0.15 and ω2 = 0.85.
Current usage metrics show cumulative count of Article Views (full-text article views including HTML views, PDF and ePub downloads, according to the available data) and Abstracts Views on Vision4Press platform.
Data correspond to usage on the plateform after 2015. The current usage metrics is available 48-96 hours after online publication and is updated daily on week days.
Initial download of the metrics may take a while.