Free Access
Fig. 10
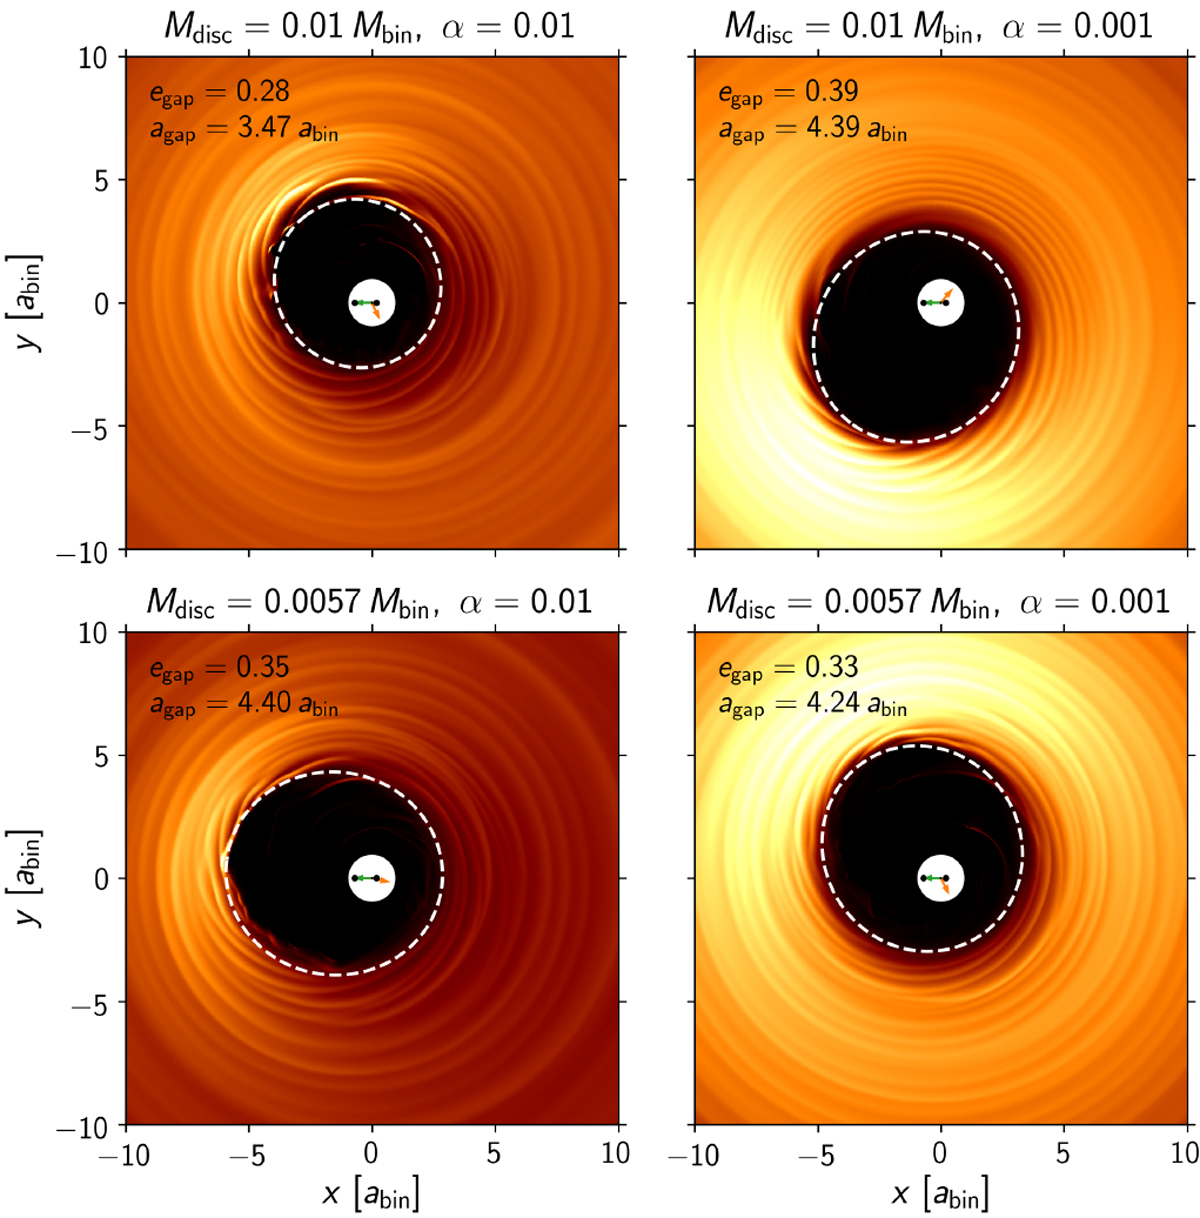
Two-dimensional density distribution of the inner disc region at a time t = 88 000. The dashed white lines and labels correspond to the approximate sizes and shapes of the inner holes. The green arrow points towards the peri-centre of the binary and the orange arrow towards the pericentre of the inner gap.
Current usage metrics show cumulative count of Article Views (full-text article views including HTML views, PDF and ePub downloads, according to the available data) and Abstracts Views on Vision4Press platform.
Data correspond to usage on the plateform after 2015. The current usage metrics is available 48-96 hours after online publication and is updated daily on week days.
Initial download of the metrics may take a while.