Fig. 5.
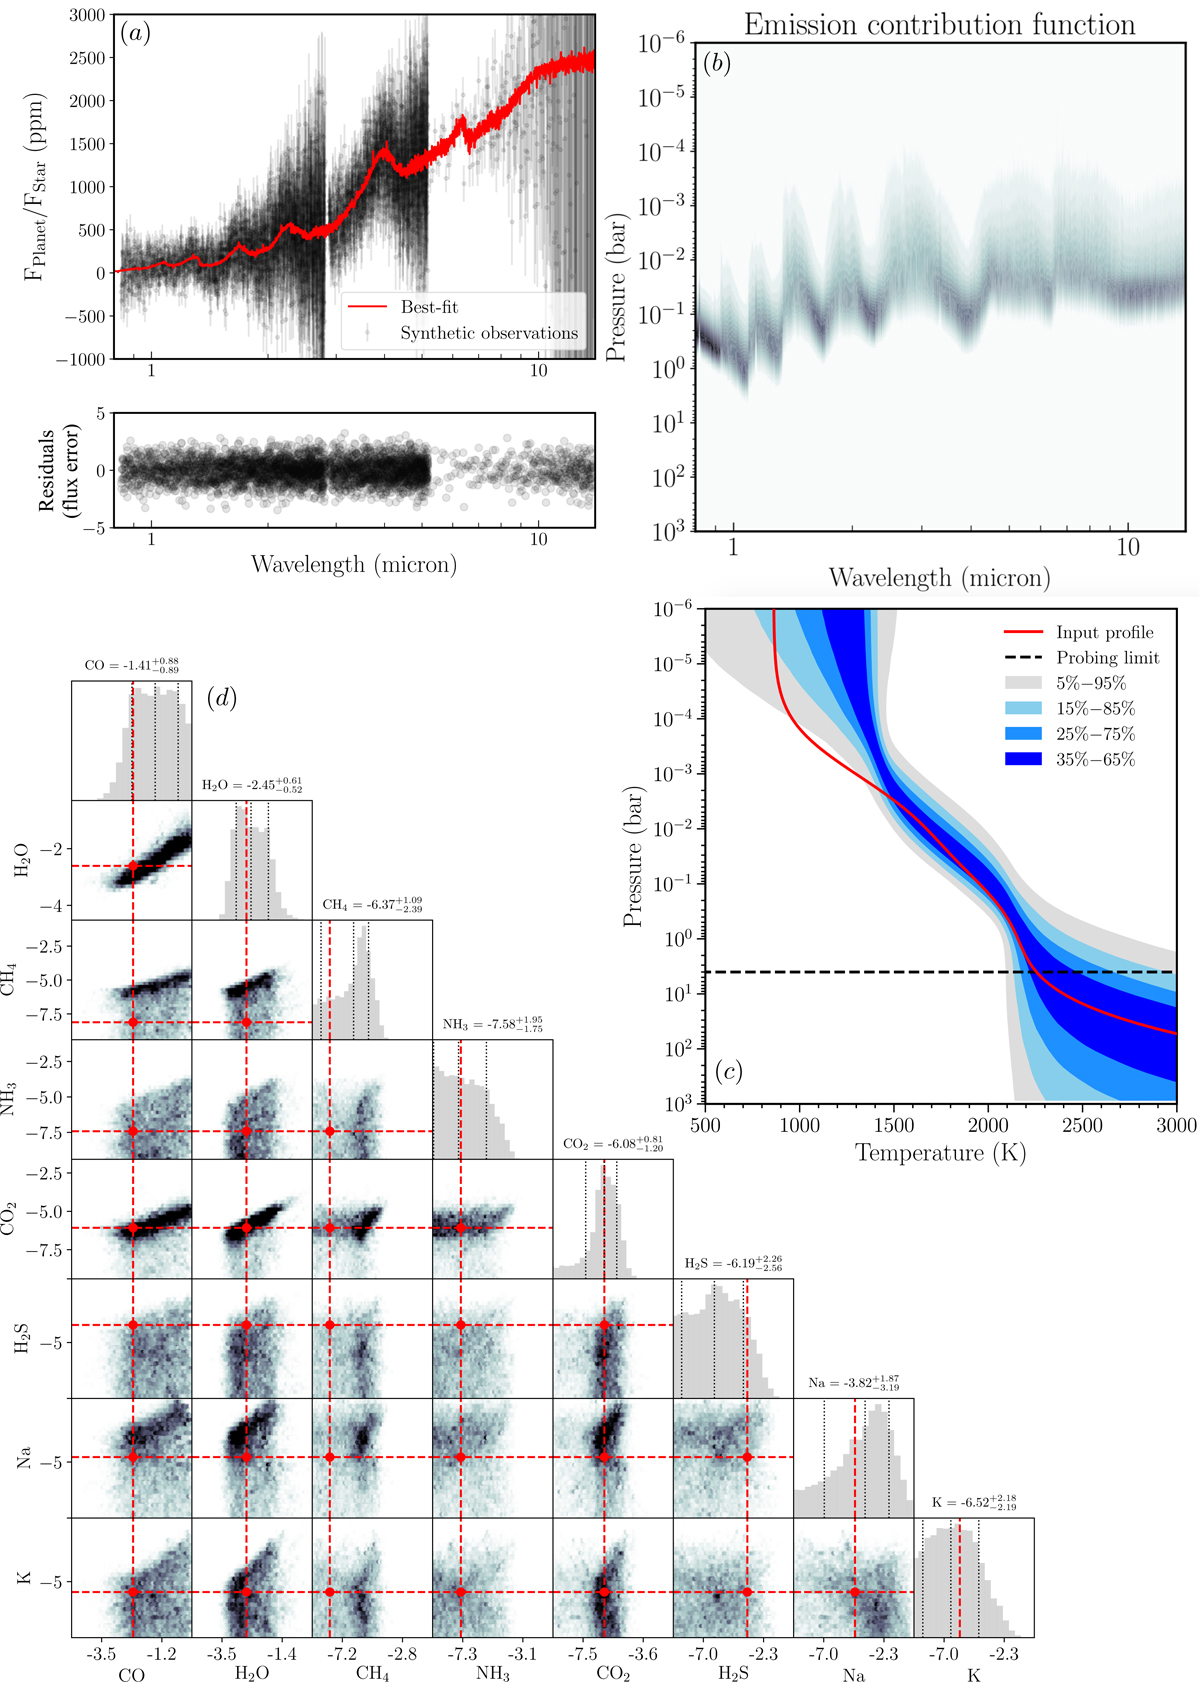
Retrieval using mock JWST emission spectra of a TrES-4b-like planet. Panel a, top: synthetic observations (black circles) and best-fit spectrum (red solid line). Panel a, bottom: residuals between the best-fit spectrum and mock observations, in units of the observational errors. Panel b: emission contribution function, calculated using Eq. (4). Pressures higher than 4 bar cannot be probed. Panel c: confidence envelopes of the retrieved P-T profiles (light gray to dark blue) and input P-T profile (red solid line). The last 600 000 samples were used for making this plot. The probing limit, inferred from panel b, is shown as a horizontal black dashed line. Below this altitude the P-T profile cannot be probed, all posterior envelopes are determined by the analytic form of the P-T function (Eq. (15)). Panel d: 2-d posterior plot of the retrieved log-mass fractions, input values are shown as red dashed lines. The last 700 000 samples were used for making this plot.
Current usage metrics show cumulative count of Article Views (full-text article views including HTML views, PDF and ePub downloads, according to the available data) and Abstracts Views on Vision4Press platform.
Data correspond to usage on the plateform after 2015. The current usage metrics is available 48-96 hours after online publication and is updated daily on week days.
Initial download of the metrics may take a while.