Fig. 2.
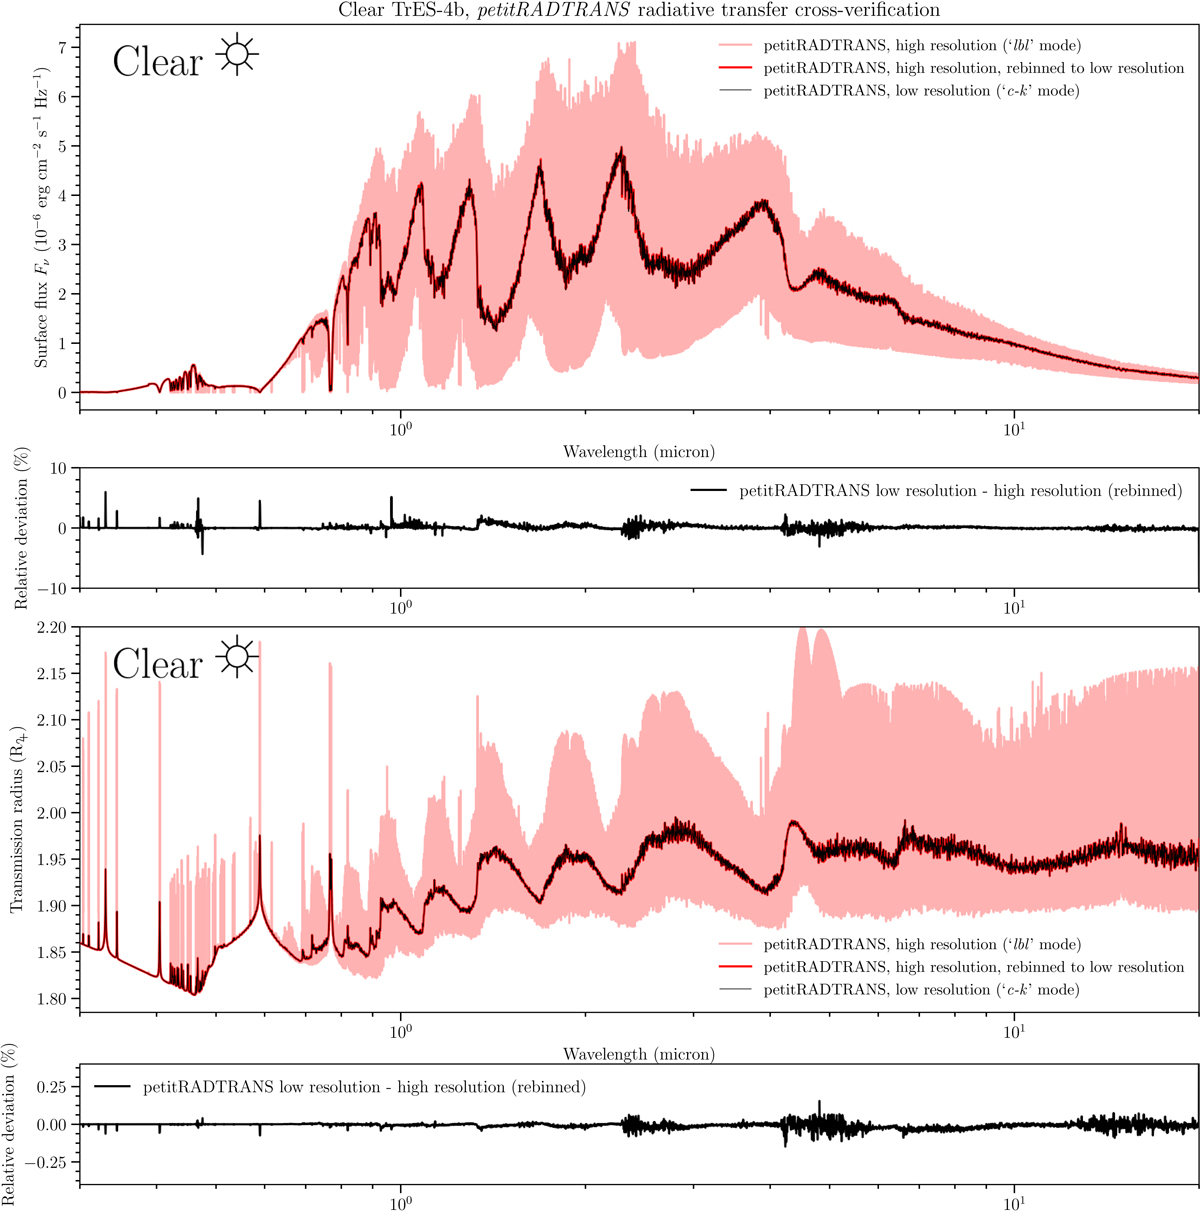
Radiative transfer verification of petitRADTRANS. Uppermost panel: comparison between the emission spectra of a clear TrES-4b-like atmosphere, calculated with petitRADTRANS in high-resolution (“lbl”) mode (light red), and in low-resolution (“c-k”) mode (black, thin line). The red line denotes the re-binned high-resolution spectrum. Panel below: residuals between the two modes. Second lowest panel: comparison between the transmission spectra of the same atmosphere, for both modes. Lowest panel: residuals between the two modes, for the transmission spectrum.
Current usage metrics show cumulative count of Article Views (full-text article views including HTML views, PDF and ePub downloads, according to the available data) and Abstracts Views on Vision4Press platform.
Data correspond to usage on the plateform after 2015. The current usage metrics is available 48-96 hours after online publication and is updated daily on week days.
Initial download of the metrics may take a while.