Fig. 8.
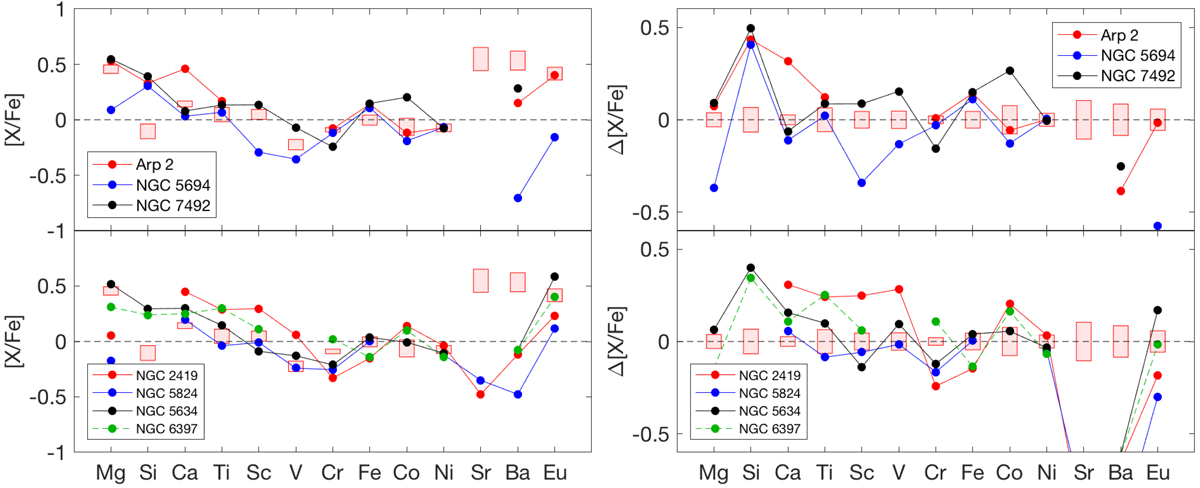
Comparison of Pal 15 (red boxes, scaled to the respective abundance scatter) with seven GCs at similar metallicities. Left panels: abundance ratios. Right panels: difference [X/Fe]GC−[X/Fe]Pal15. To help readability, the figures are split into two panels each. Top panels: three objects at −1.8 dex, and bottom panels: remaining more metal-poor reference GCs. For iron, we show [Fe/H] relative to the Pal 15 mean.
Current usage metrics show cumulative count of Article Views (full-text article views including HTML views, PDF and ePub downloads, according to the available data) and Abstracts Views on Vision4Press platform.
Data correspond to usage on the plateform after 2015. The current usage metrics is available 48-96 hours after online publication and is updated daily on week days.
Initial download of the metrics may take a while.