Fig. 5.
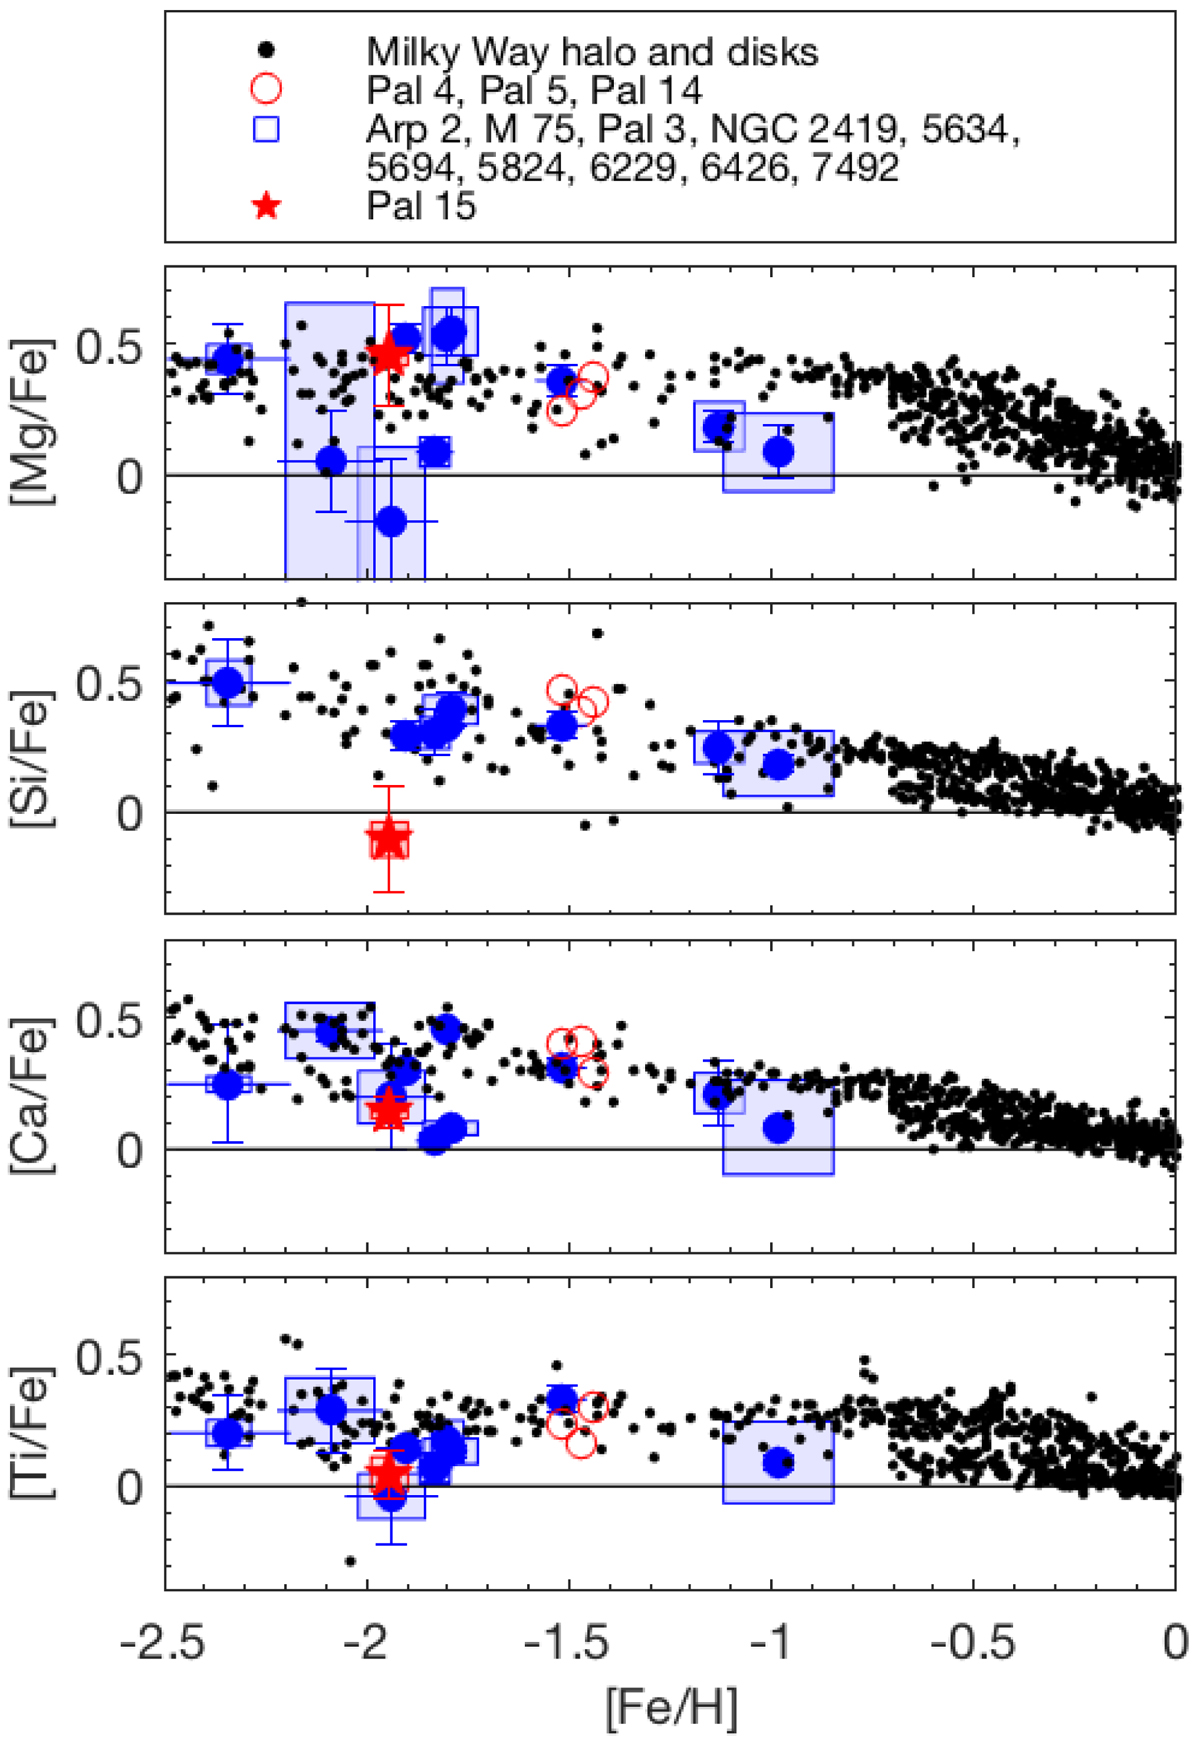
Abundances of the α-elements for Pal 15 (red star) and the reference outer halo GCs. Here, red open circles show GCs with mean abundances derived from co-added spectra. The blue boxplots refer to the observed 1σ spread in a given GC (extent of the boxes in either dimension), while the inlaid error bars depict the mean abundance error on the respective measurements.
Current usage metrics show cumulative count of Article Views (full-text article views including HTML views, PDF and ePub downloads, according to the available data) and Abstracts Views on Vision4Press platform.
Data correspond to usage on the plateform after 2015. The current usage metrics is available 48-96 hours after online publication and is updated daily on week days.
Initial download of the metrics may take a while.