Fig. 4
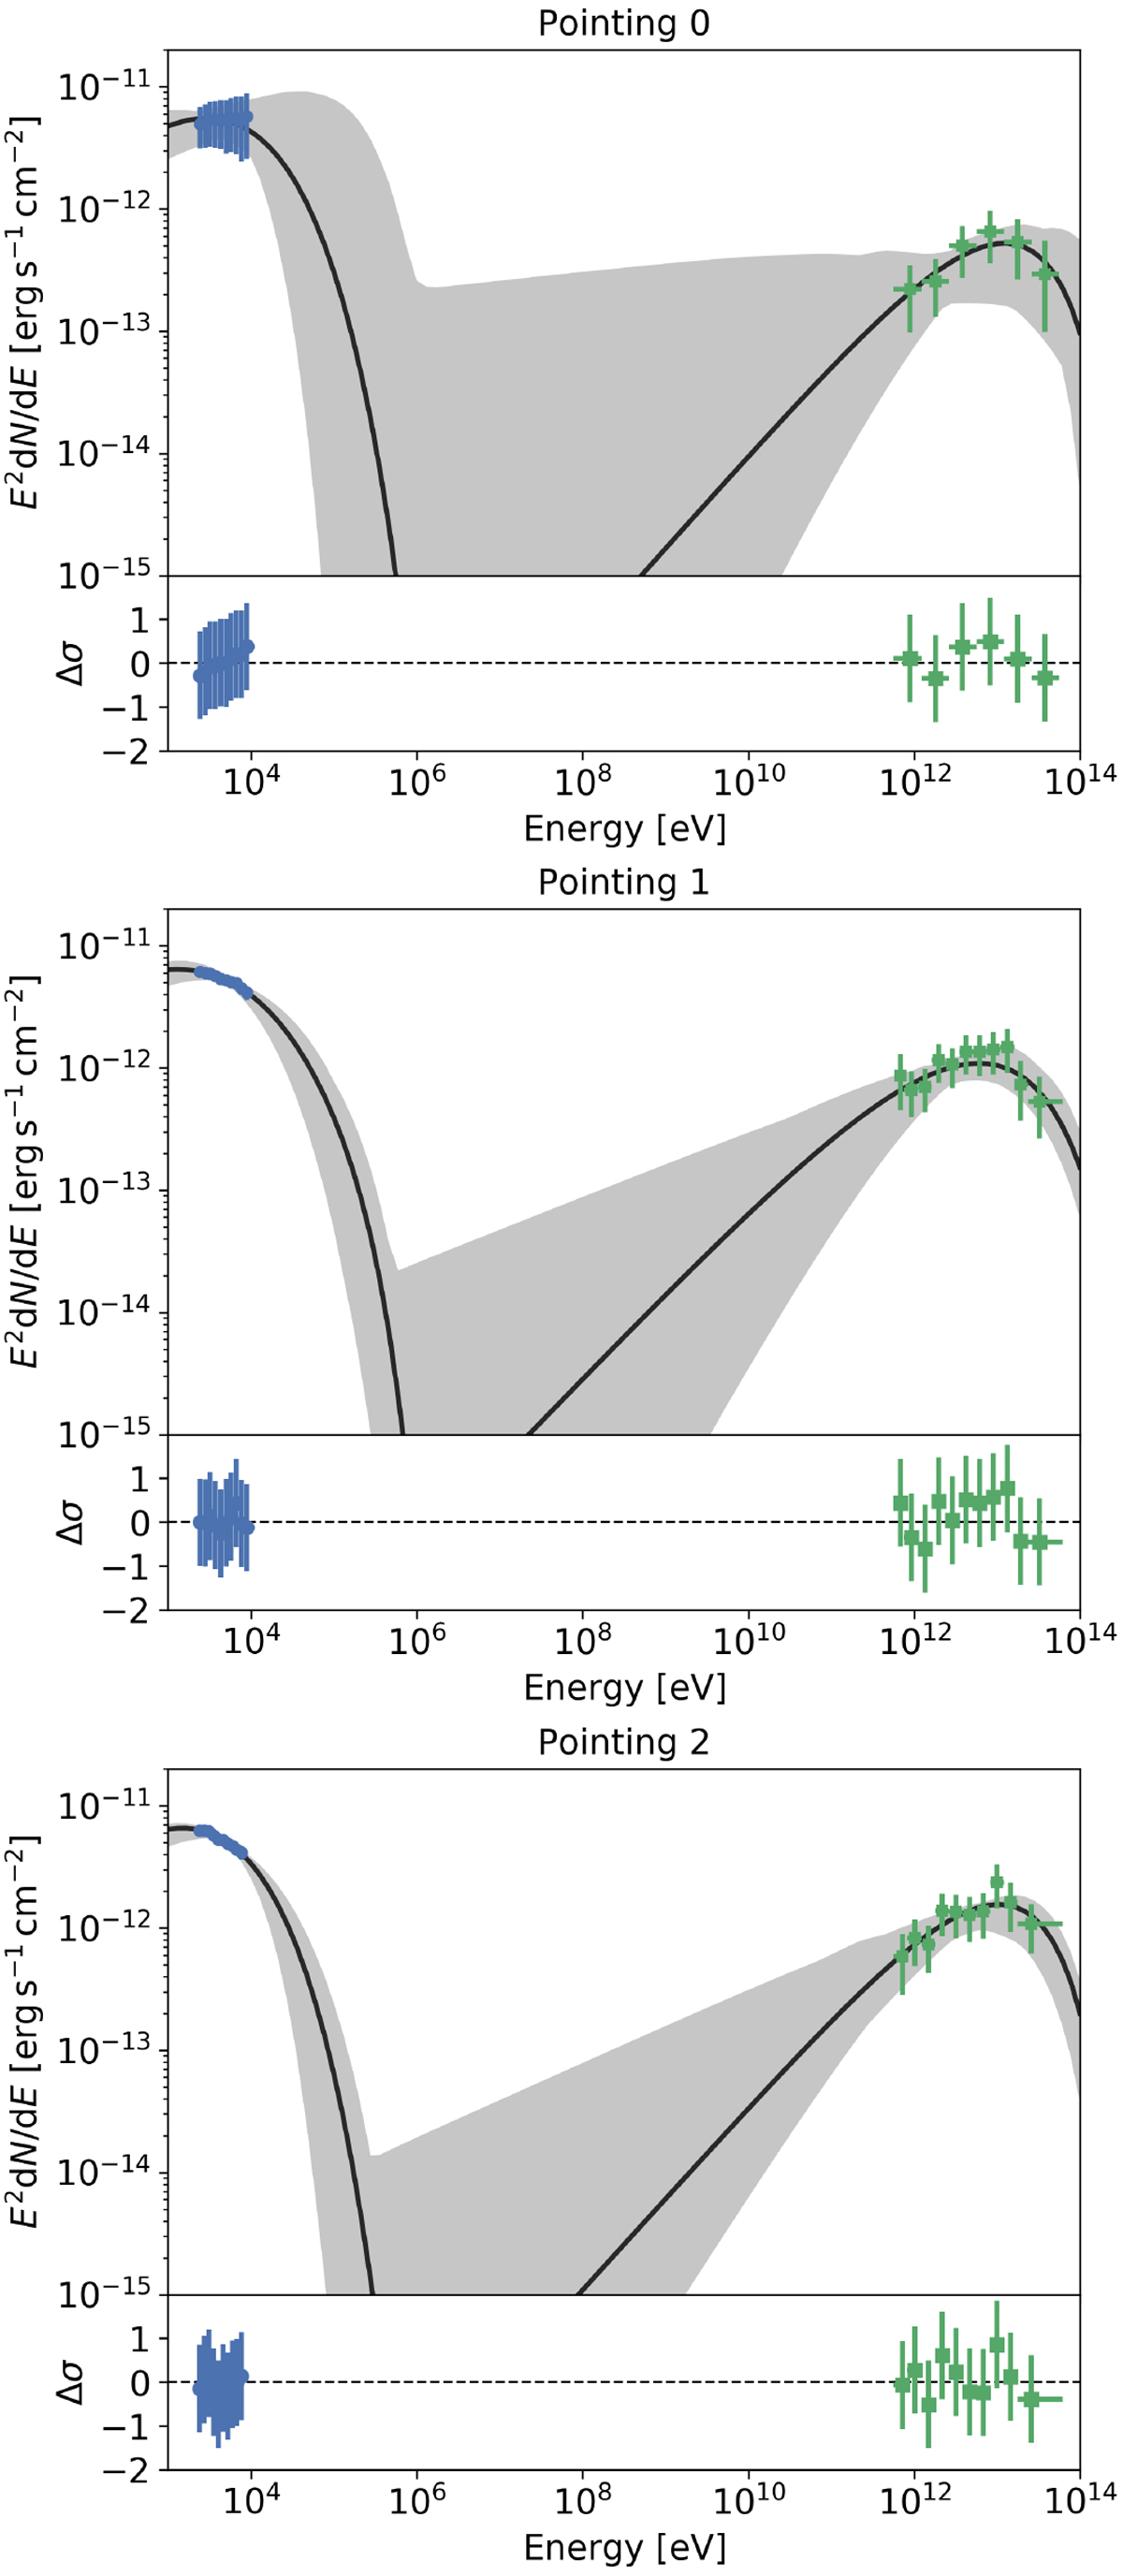
Multi-wavelength spectral-energy distributions (SEDs) from the three regions studied in the Vela X cocoon. Blue pointsare derived from X-ray measurements with the Suzaku XIS (Sect. 3), and green points from the gamma-ray measurements with H.E.S.S. (Sect. 4). Error bars combine statistical and systematic uncertainties as described in text. Top, middle, and bottom panels: extraction regions 0, 1, and 2, respectively. In the upper sub-plot of each panel, radiative models are overlaid to the SED points. In the lower subplot, the residuals for the best fit parameters are shown. The models are based on a single population of leptons producing synchrotron emission in a uniform-strength magnetic field and inverse-Compton emission on the cosmicmicrowave background and diffuse infrared radiation. The black line shows the best-fit (minimum χ2) model, while the shaded bands represent the 95% confidence level bands from the Markov chain Monte Carlo scan.
Current usage metrics show cumulative count of Article Views (full-text article views including HTML views, PDF and ePub downloads, according to the available data) and Abstracts Views on Vision4Press platform.
Data correspond to usage on the plateform after 2015. The current usage metrics is available 48-96 hours after online publication and is updated daily on week days.
Initial download of the metrics may take a while.