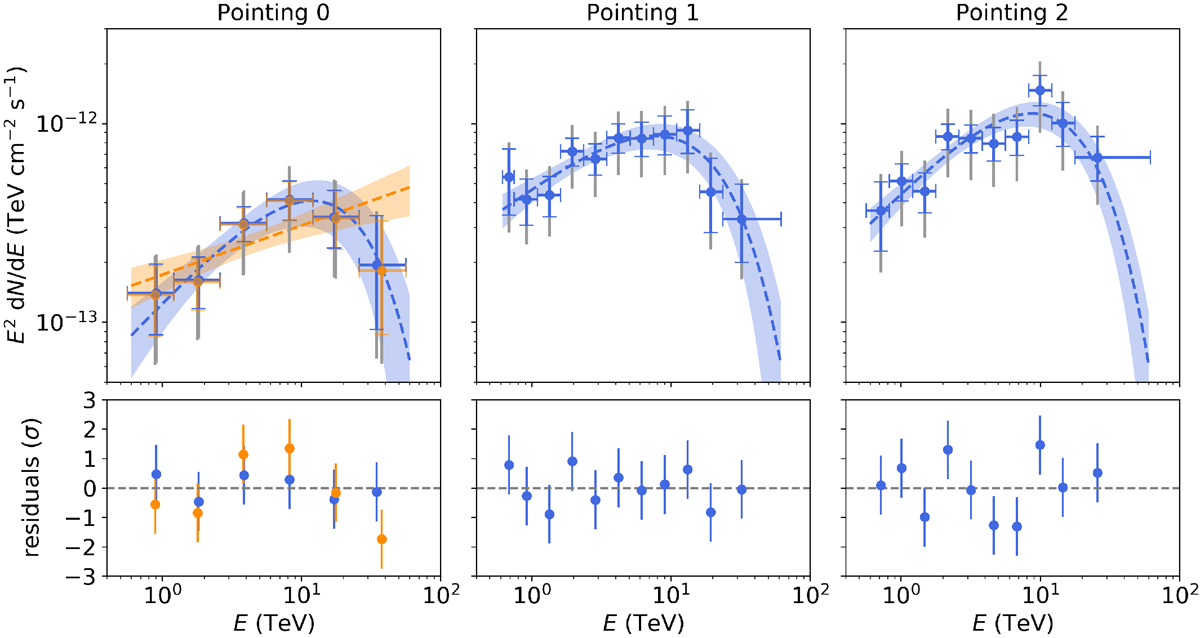
Fig. 3

SEDs of gamma-ray emission measured by H.E.S.S. for the three extraction regions shown in Fig. 1. Top panel: lines show the best-fit spectral models, and the bands display the statistical uncertainties based on quadratic error propagation from the inversion of the likelihood Hessian matrix. Points show the binned SEDs with their statistical uncertainties (coloured error bars with end caps) and the sum in quadrature of statistical and systematic uncertainties (grey error bars without end caps). Bottom panel: deviation of the SED points from the best-fit function as number of statistical σ. For Pointing 0, orange corresponds to the PL fit, and blue to the ECPL fit.
Current usage metrics show cumulative count of Article Views (full-text article views including HTML views, PDF and ePub downloads, according to the available data) and Abstracts Views on Vision4Press platform.
Data correspond to usage on the plateform after 2015. The current usage metrics is available 48-96 hours after online publication and is updated daily on week days.
Initial download of the metrics may take a while.


