Fig. 1
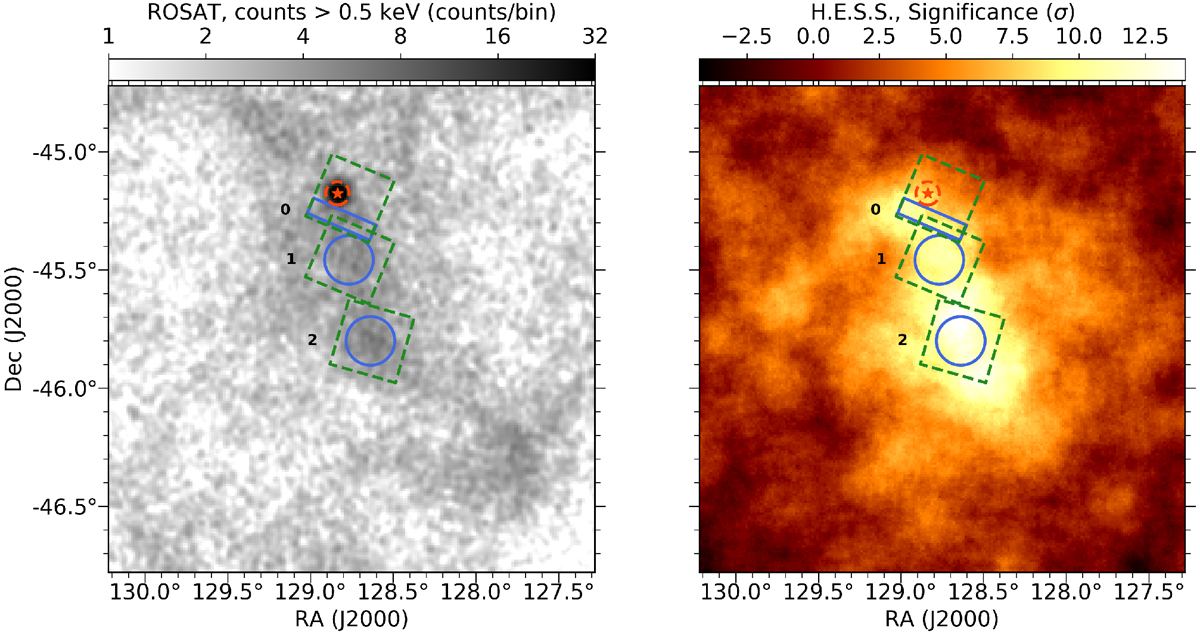
Regions used for spectral analysis (blue box and circles) overlaid onto two maps of the Vela X region. Left panel: X-ray count map from the ROSAT survey at energies > 0.5 keV. Right panel: significance map from H.E.S.S. at energies >0.6 TeV (see Sect. 4 for details on how the map is derived, the map is oversampled with a correlation radius of
![]() for display).The red star indicates the position of the Vela pulsar and its size approximately corresponds to that of the jet-torus structure measured with Chandra (Manzali et al. 2007). The dashed red circle represents the 95% containment radius of the Suzaku point spread function around the pulsar. The dashed green squares indicate the borders of the Suzaku field of view for the three pointings used in this paper.
for display).The red star indicates the position of the Vela pulsar and its size approximately corresponds to that of the jet-torus structure measured with Chandra (Manzali et al. 2007). The dashed red circle represents the 95% containment radius of the Suzaku point spread function around the pulsar. The dashed green squares indicate the borders of the Suzaku field of view for the three pointings used in this paper.
Current usage metrics show cumulative count of Article Views (full-text article views including HTML views, PDF and ePub downloads, according to the available data) and Abstracts Views on Vision4Press platform.
Data correspond to usage on the plateform after 2015. The current usage metrics is available 48-96 hours after online publication and is updated daily on week days.
Initial download of the metrics may take a while.