Fig. 9.
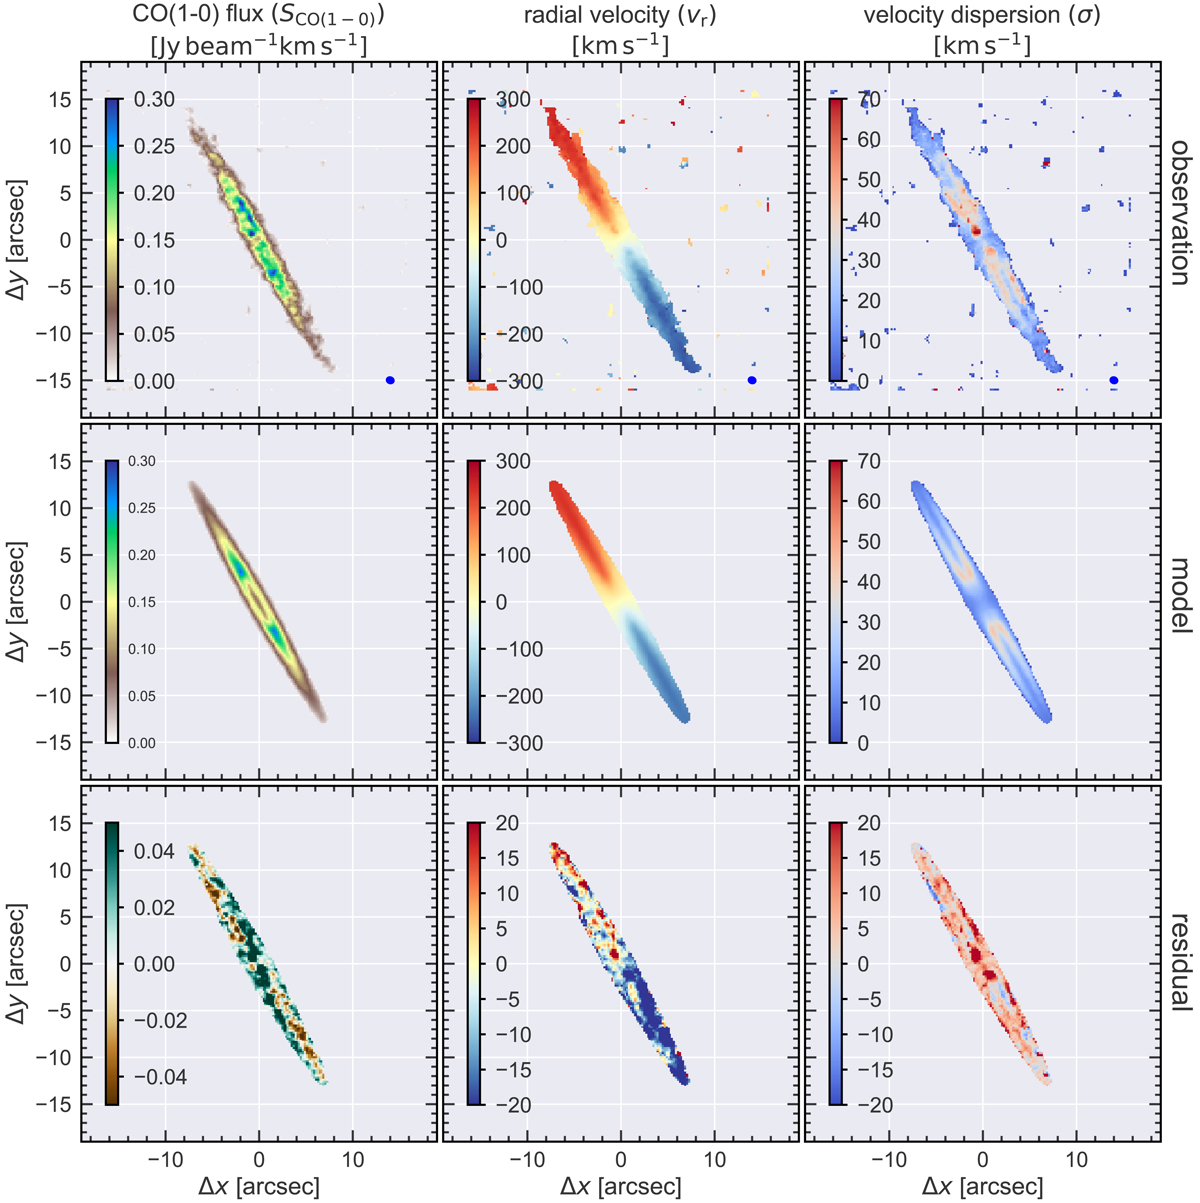
Kinematic modelling of the molecular gas traced by CO(1-0). Upper panels: Moment maps of the CO(1-0) line from the ALMA observations. The beam size is indicated in all panels as the filled blue elliptical in the lower right for comparison. Middle panels: best-fit kinematic model determined with the KinMS software tool (Davis et al. 2013a). Lower panels: residuals of the best-fit model maps compared to the original data.
Current usage metrics show cumulative count of Article Views (full-text article views including HTML views, PDF and ePub downloads, according to the available data) and Abstracts Views on Vision4Press platform.
Data correspond to usage on the plateform after 2015. The current usage metrics is available 48-96 hours after online publication and is updated daily on week days.
Initial download of the metrics may take a while.