Fig. 7.
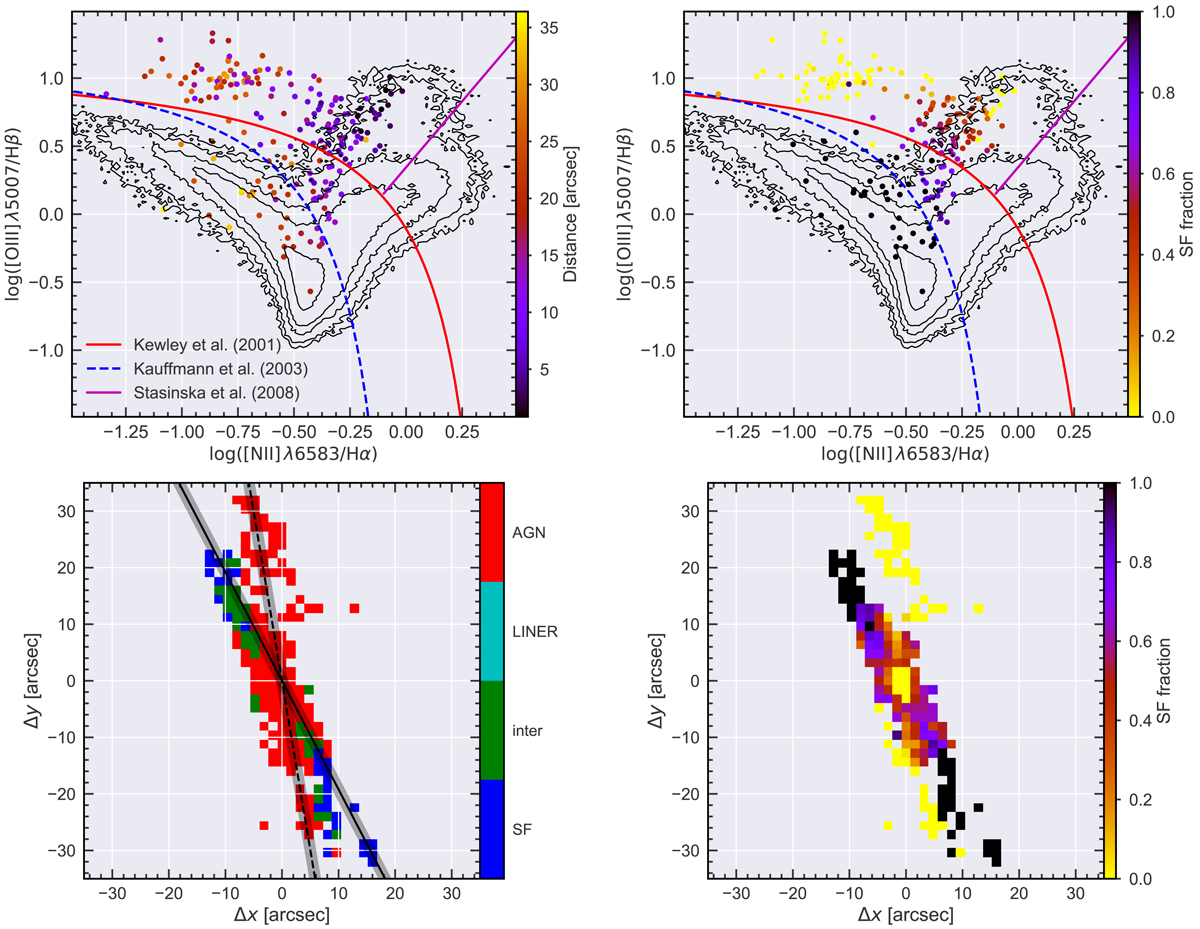
Top left panel: classical BPT [O III]/Hβ vs. [N II]/Hα diagnostic plot after binning the MUSE data to ![]() spatial sampling. The distance from the nucleus is color coded and the distribution of line ratios from the SDSS MPA/JHU catalog is shown as contours for comparison. Demarcation curves from Kauffmann et al. (2003) (dashed blue line), Kewley & Dopita (2002) (red solid line) and Stasińska et al. (2008) (solid magenta line) are displayed for reference. Top right panel: same as the left panel where the color coding represent the SF fraction to the emission line measured as described in the main text. The SF fraction is set to zero for emission regions above the galaxy disc and set to one for regions below the (Kauffmann et al. 2003) demarcation line. Bottom left panel: 2D excitation classification map based on the boundaries set by the demarcation lines. The solid and dashed line represent the primary disc galaxy axis (∼28° with respect to North) and an ENLR axis along (∼10° with respect to North) the strongest emission, respectively. The black shaded area around the axis indicates the 2″-wide pseudo long-slit extraction region for the metallicity gradients shown in Fig. 8. Bottom right panel: spatial distribution of the SF fraction as defined from the emission-line ratios.
spatial sampling. The distance from the nucleus is color coded and the distribution of line ratios from the SDSS MPA/JHU catalog is shown as contours for comparison. Demarcation curves from Kauffmann et al. (2003) (dashed blue line), Kewley & Dopita (2002) (red solid line) and Stasińska et al. (2008) (solid magenta line) are displayed for reference. Top right panel: same as the left panel where the color coding represent the SF fraction to the emission line measured as described in the main text. The SF fraction is set to zero for emission regions above the galaxy disc and set to one for regions below the (Kauffmann et al. 2003) demarcation line. Bottom left panel: 2D excitation classification map based on the boundaries set by the demarcation lines. The solid and dashed line represent the primary disc galaxy axis (∼28° with respect to North) and an ENLR axis along (∼10° with respect to North) the strongest emission, respectively. The black shaded area around the axis indicates the 2″-wide pseudo long-slit extraction region for the metallicity gradients shown in Fig. 8. Bottom right panel: spatial distribution of the SF fraction as defined from the emission-line ratios.
Current usage metrics show cumulative count of Article Views (full-text article views including HTML views, PDF and ePub downloads, according to the available data) and Abstracts Views on Vision4Press platform.
Data correspond to usage on the plateform after 2015. The current usage metrics is available 48-96 hours after online publication and is updated daily on week days.
Initial download of the metrics may take a while.