Fig. 6.
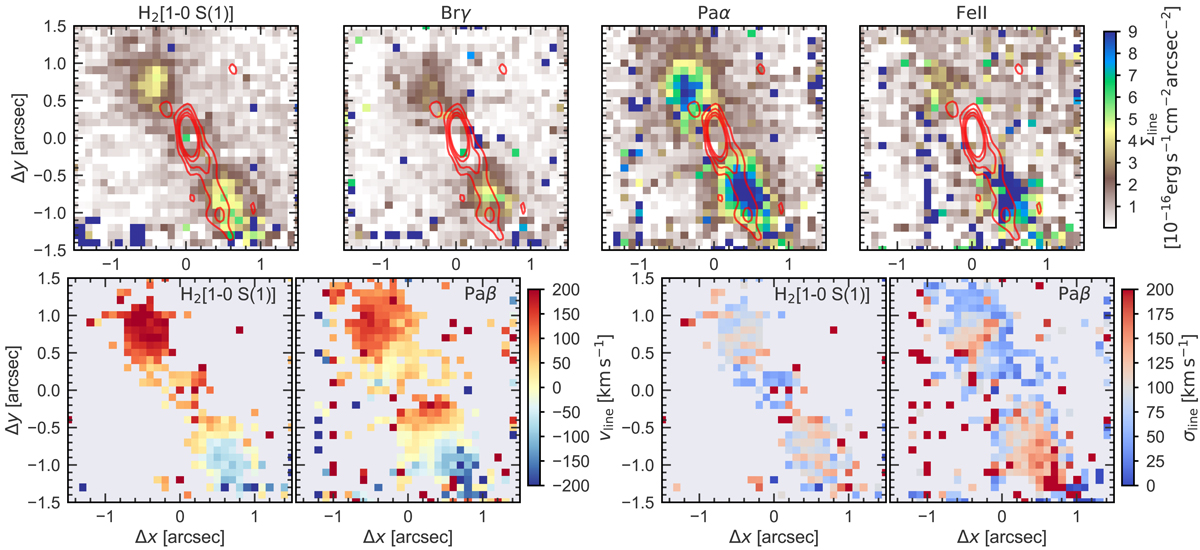
Top panels: surface brightness maps for the H2 [1-0 S(1)] λ21218 Å, Brγ, Paβ and [Fe II] λ12570 Å emission lines in our Gemini-NIFS NIR observations after subtracting the point-like AGN contribution. The red contours correspond to the distribution of 10 GHz radio continuum emission as resolved with our VLA radio interferometric observations. Lower panels: radial velocity and velocity dispersion for the two brightest lines, H2 and Paβ respectively.
Current usage metrics show cumulative count of Article Views (full-text article views including HTML views, PDF and ePub downloads, according to the available data) and Abstracts Views on Vision4Press platform.
Data correspond to usage on the plateform after 2015. The current usage metrics is available 48-96 hours after online publication and is updated daily on week days.
Initial download of the metrics may take a while.