Fig. 5.
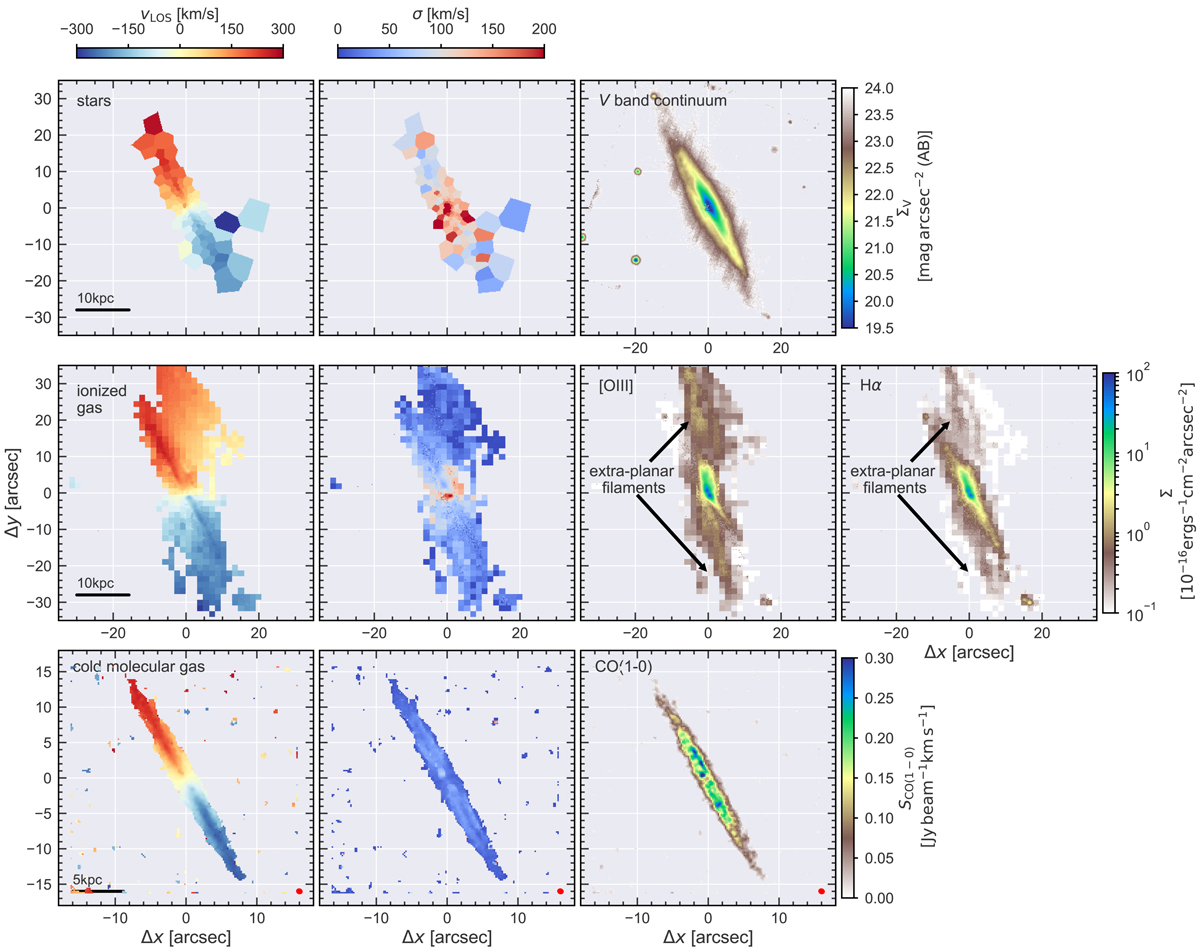
Maps of the stellar (first row), ionised gas (second row) and cold molecular gas (third row) kinematics and flux distribution. The first column shows the line-of-sight LOS velocity with respect to the systemic velocity of the galaxy, the second column is the velocity dispersion and third/forth column highlights the surface brightness of the respective tracer. The beam size for the ALMA observations is indicated as a red symbol in the respective panels.
Current usage metrics show cumulative count of Article Views (full-text article views including HTML views, PDF and ePub downloads, according to the available data) and Abstracts Views on Vision4Press platform.
Data correspond to usage on the plateform after 2015. The current usage metrics is available 48-96 hours after online publication and is updated daily on week days.
Initial download of the metrics may take a while.