Fig. 4.
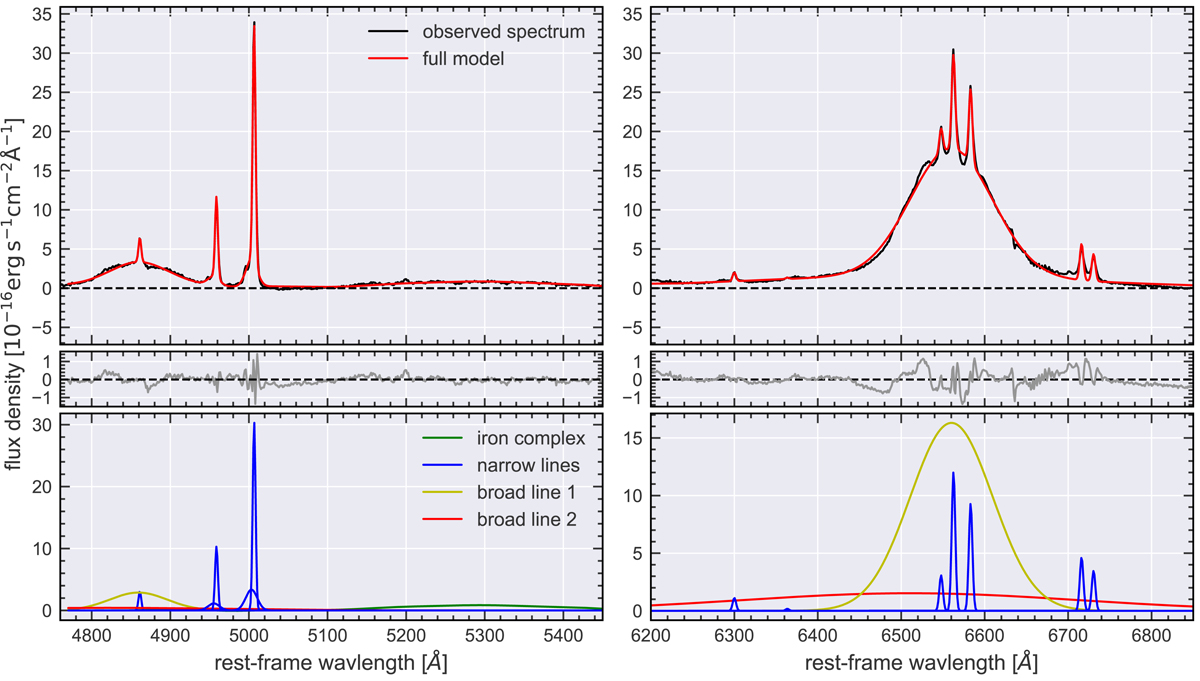
Fit to the nuclear spectrum of HE 1353−1917 in the wavelength regions around Hβ and Hα after continuum subtraction. Upper panels: overlay of the nuclear spectrum (black) and the total fit (red). The residuals from the fit are indicated in gray (offset from the nuclear spectrum for better visibility). Lower panels: individual Gaussian components fitted to the nuclear spectrum together with an Fe II template from Kovačević et al. (2010). All components shown with the same color were kinematically tied to each other during the fit. This includes the narrow components (Hβn, [O III] λ4959 and λ5007, [O I] λ6300 and λ6364, [N II] λ6548 and λ6583, and Hαn and [S II] λλ6717, 6731) shown in blue, the broad components (Hβb and Hαb) shown in yellow, and the very broad components (Hβvb and Hαvb) shown in red.
Current usage metrics show cumulative count of Article Views (full-text article views including HTML views, PDF and ePub downloads, according to the available data) and Abstracts Views on Vision4Press platform.
Data correspond to usage on the plateform after 2015. The current usage metrics is available 48-96 hours after online publication and is updated daily on week days.
Initial download of the metrics may take a while.