Fig. 2.
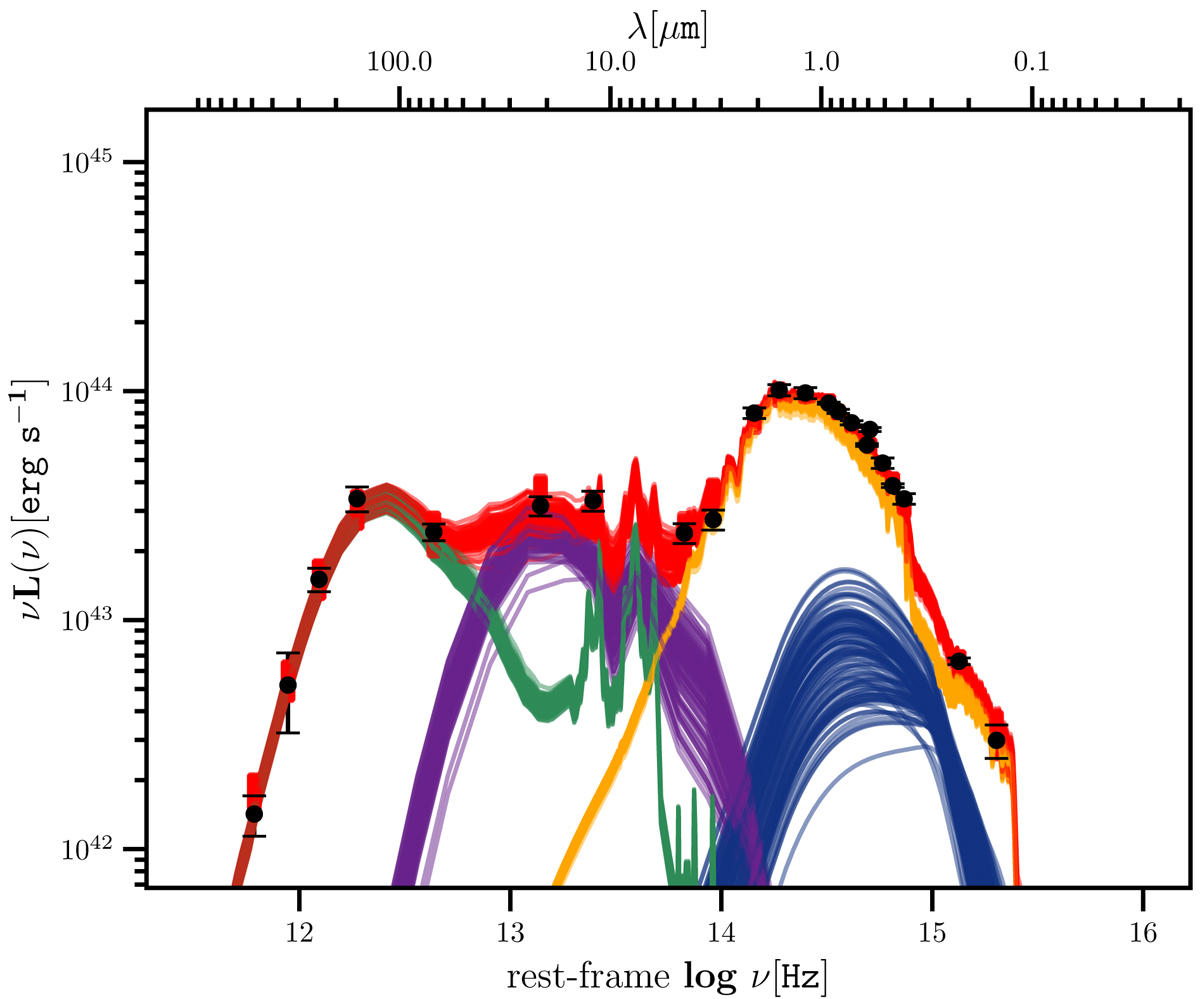
Broad-band SED of HE 1353−1917 and best-fit template models inferred with AGNFITTER (Calistro Rivera et al. 2016). The black points represent the observed photometric data with their associated error bars. One hundred representative template SEDs are overplotted from the MCMC sampling. The total SEDs are shown as red lines which are further split up into their sub-component, (1) the AGN optical-UV emission (blue lines), (2) the stellar continuum (yellow lines), (3) the hot torus emission (purple lines), and (4) the cold+warm dust emission from star formation (green lines).
Current usage metrics show cumulative count of Article Views (full-text article views including HTML views, PDF and ePub downloads, according to the available data) and Abstracts Views on Vision4Press platform.
Data correspond to usage on the plateform after 2015. The current usage metrics is available 48-96 hours after online publication and is updated daily on week days.
Initial download of the metrics may take a while.