Fig. A.4.
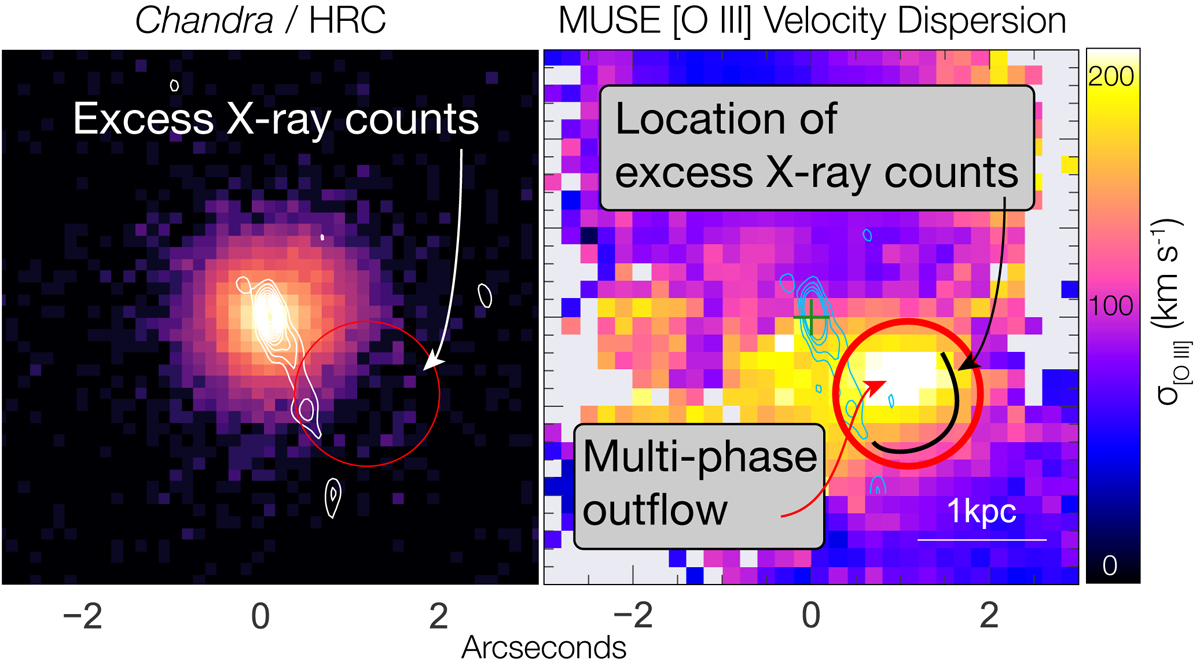
Comparison of the Chandra X-ray image with the location of the outflow. This figure highlights a ∼10 X-ray count excess over the local azimuthal (background plus PSF wing) average, arranged in a semicircular arc ∼2″SW of the nucleus. The feature is labeled with a white arrow in the left panel, which shows the exposure-corrected Chandra/HRC image at the native pixel scale (0![]() 13 per pixel). While the significance of < 2σ of this feature is too low for confident detection, it is co-spatial with the rim of the multi-phase outflow discussed in this paper. This is highlighted comparing the red (identical, WCS-matched) circles in both the Chandra and MUSE gas velocity dispersion panels (right and left, respectively).
13 per pixel). While the significance of < 2σ of this feature is too low for confident detection, it is co-spatial with the rim of the multi-phase outflow discussed in this paper. This is highlighted comparing the red (identical, WCS-matched) circles in both the Chandra and MUSE gas velocity dispersion panels (right and left, respectively).
Current usage metrics show cumulative count of Article Views (full-text article views including HTML views, PDF and ePub downloads, according to the available data) and Abstracts Views on Vision4Press platform.
Data correspond to usage on the plateform after 2015. The current usage metrics is available 48-96 hours after online publication and is updated daily on week days.
Initial download of the metrics may take a while.