Fig. 15.
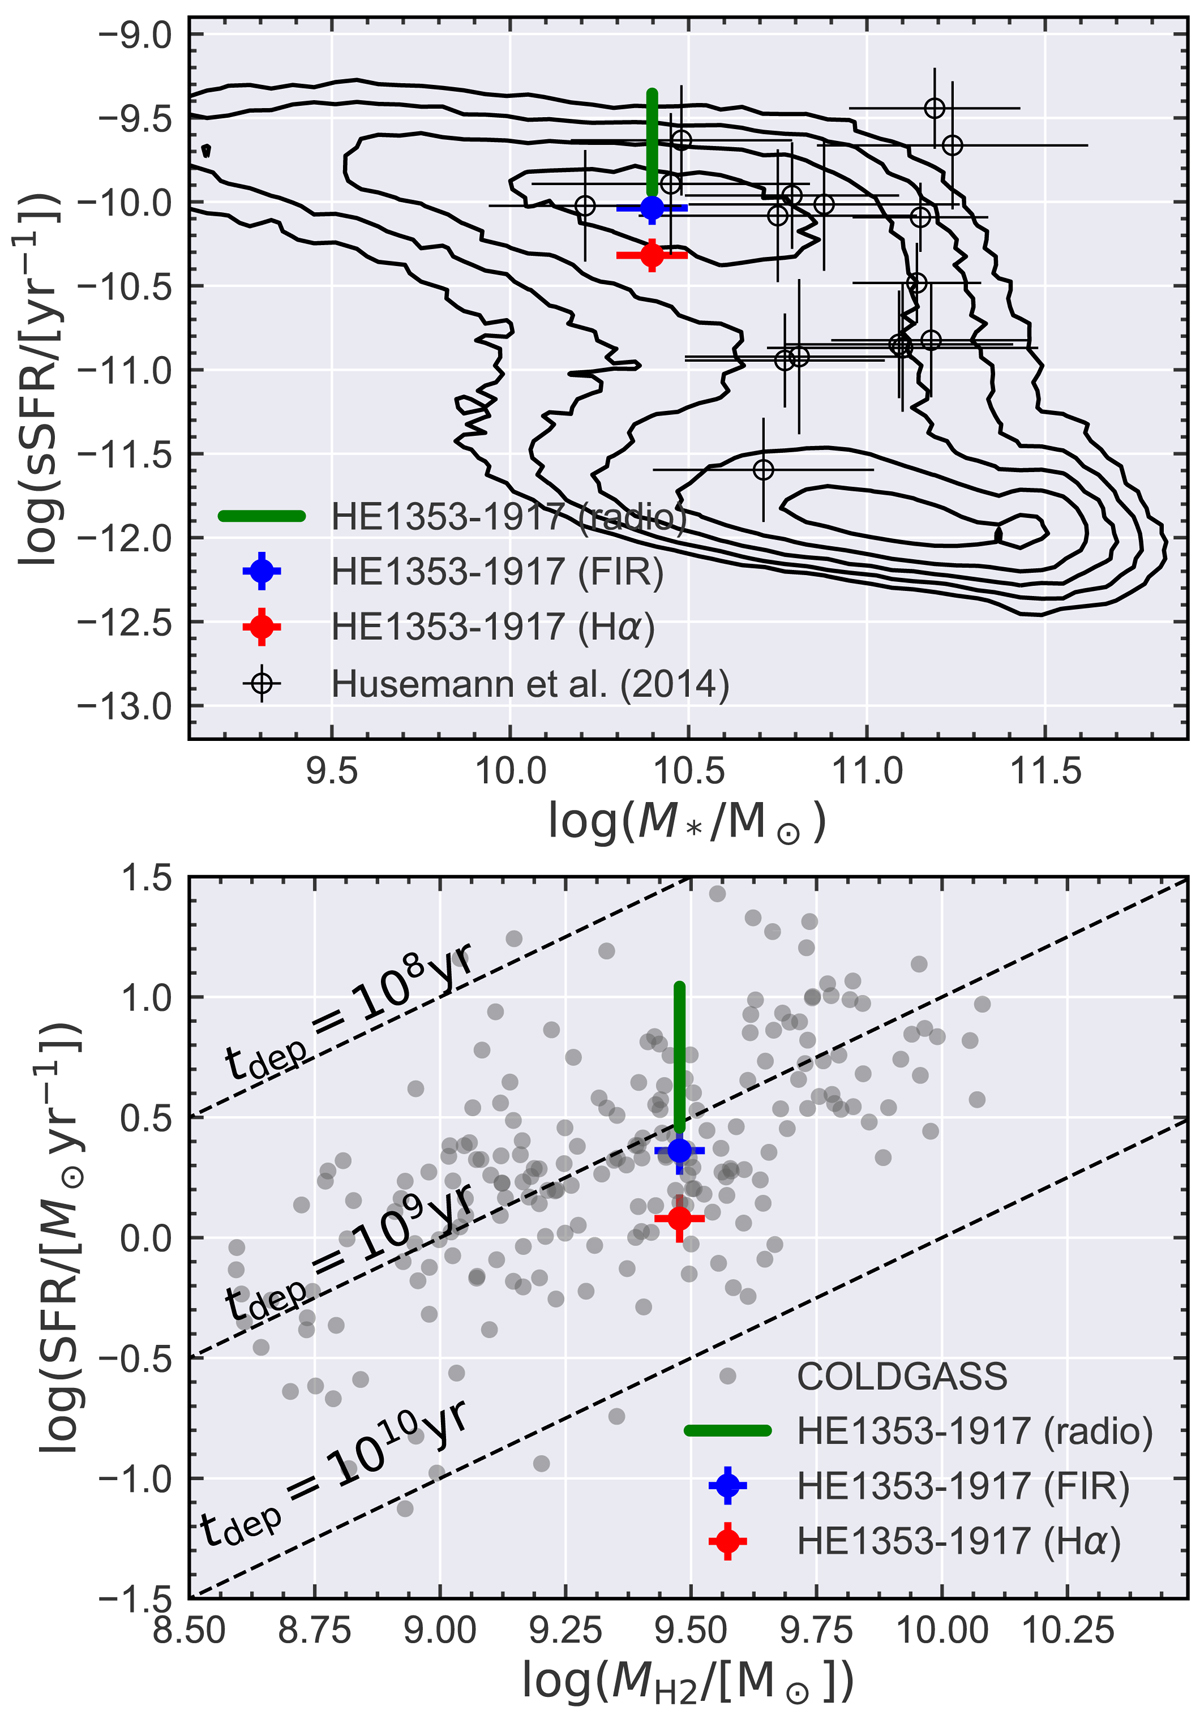
Upper panel: specific star formation rate against stellar mass. Contours highlight the distribution of local galaxies as probed by SDSS DR7 (Brinchmann et al. 2004). The position of HE 1353−1917 is denoted by the filled symbols, where the SFR is traced by the FIR continuum (blue symbol) and by the Hα emission lines (red symbol) after deblending with the ENLR contribution as discussed in the text. The open symbols represent a local sample of luminous AGN with Hα-based SFR measurements from Husemann et al. (2014) for comparison. Lower panel: star formation rate (SFR) against molecular gas mass (MH2). The gray symbols represent the properties of a local galaxy sample from the COLDGASS survey (Saintonge et al. 2011). The dashed diagonal lines represent constant value of the gas depletion time. The colored symbols are the measurements for HE 1353−1917 as in the upper panel.
Current usage metrics show cumulative count of Article Views (full-text article views including HTML views, PDF and ePub downloads, according to the available data) and Abstracts Views on Vision4Press platform.
Data correspond to usage on the plateform after 2015. The current usage metrics is available 48-96 hours after online publication and is updated daily on week days.
Initial download of the metrics may take a while.