Fig. 14.
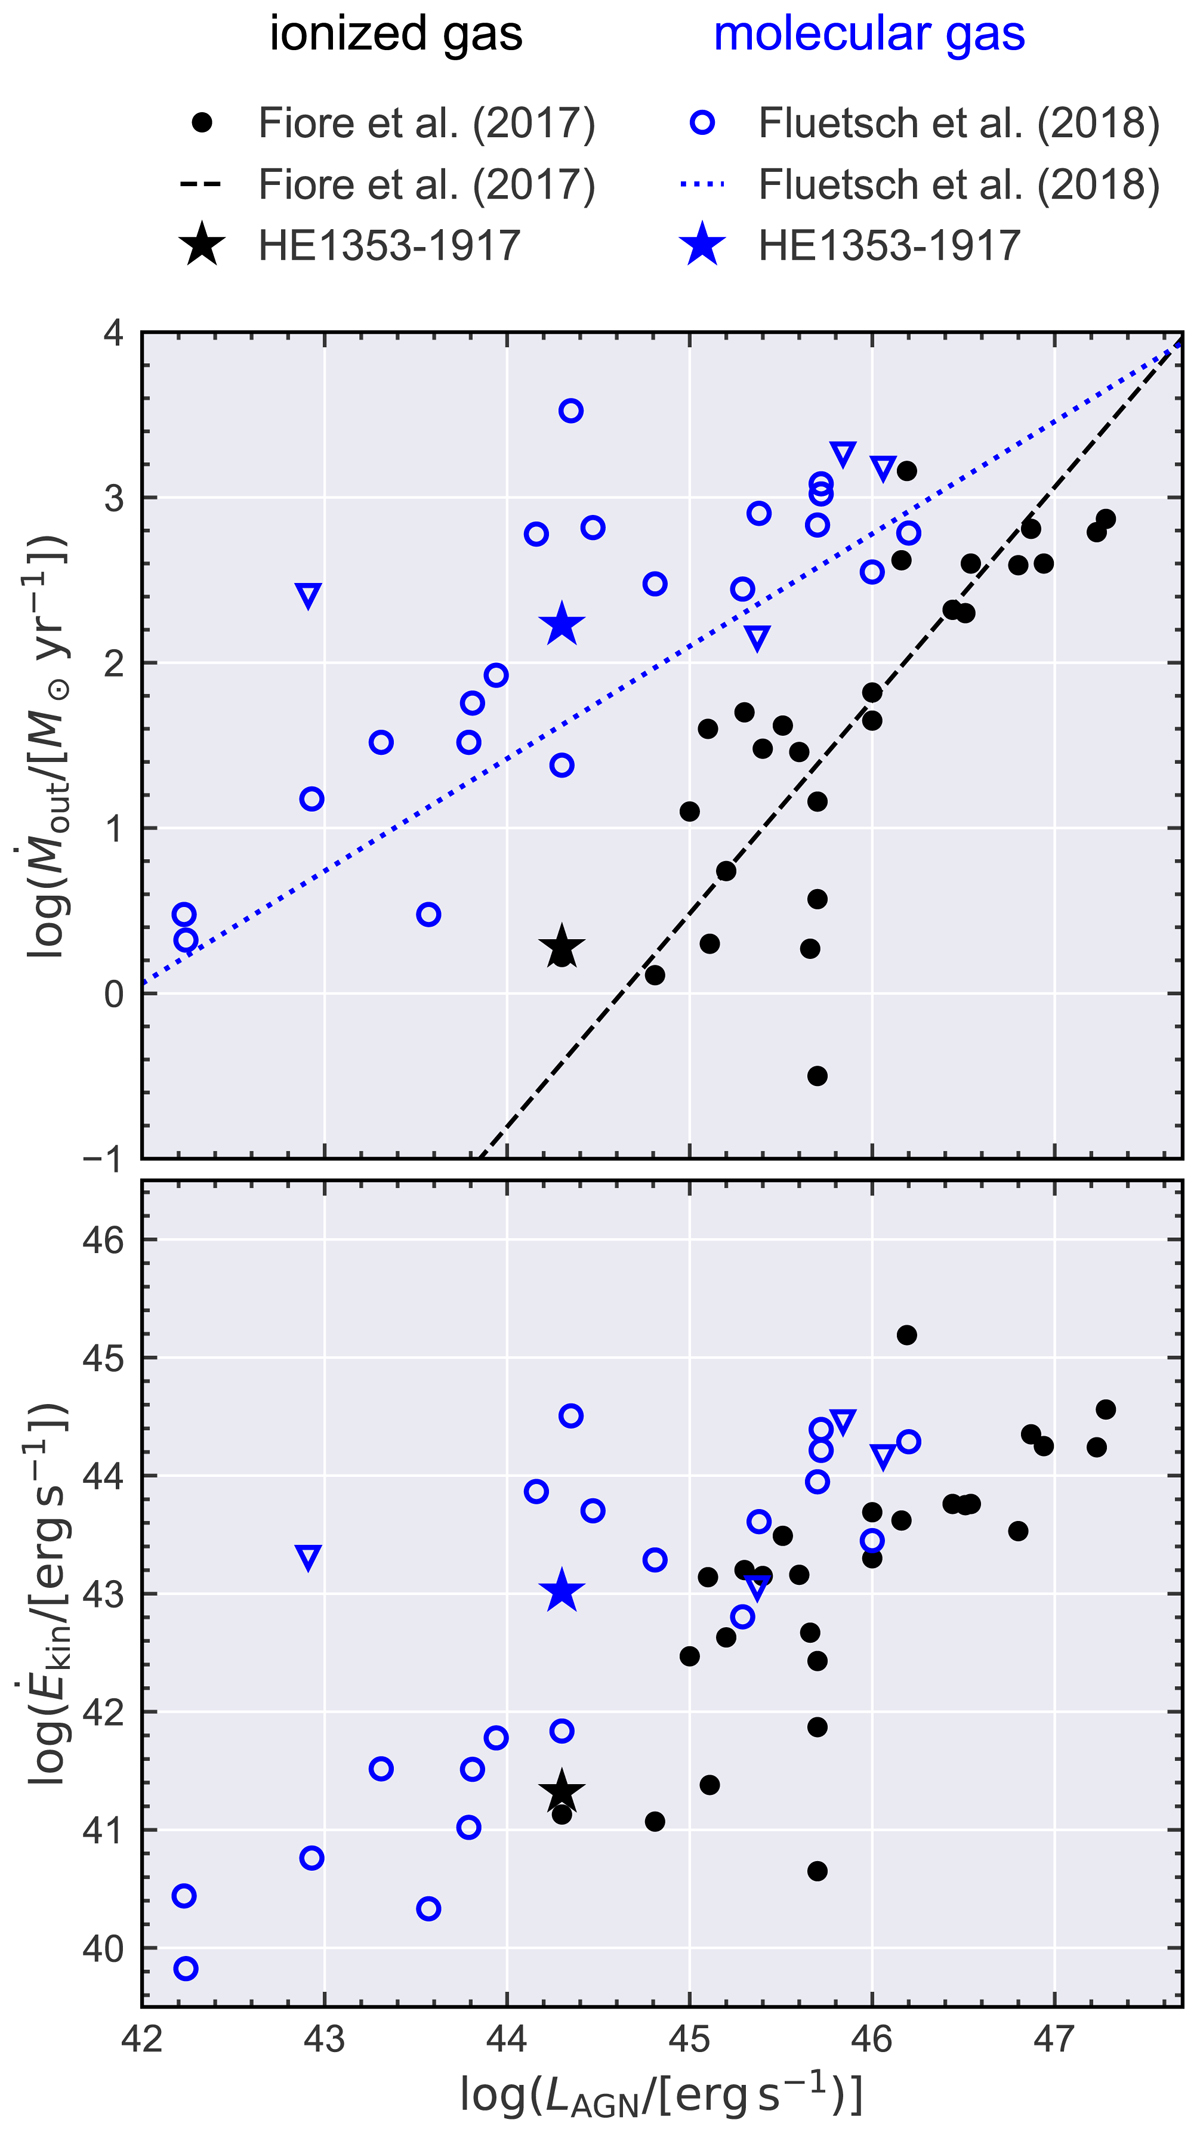
Comparison of mass outflow rate (upper panel) and kinetic power (lower panel) with AGN bolometric luminosity as computed for a conical outflow geometry as described in the text. Literature compilations of AGN outflow in the ionised gas phase (black symbols) and the molecular gas phase (blue symbols) are taken from Fiore et al. (2017) and Fluetsch et al. (2019), respectively. The measurements for HE 1353−1917 are denoted by the star symbol. Best-fit correlations for the literature compilation are shown as dashed lines.
Current usage metrics show cumulative count of Article Views (full-text article views including HTML views, PDF and ePub downloads, according to the available data) and Abstracts Views on Vision4Press platform.
Data correspond to usage on the plateform after 2015. The current usage metrics is available 48-96 hours after online publication and is updated daily on week days.
Initial download of the metrics may take a while.