Fig. 13.
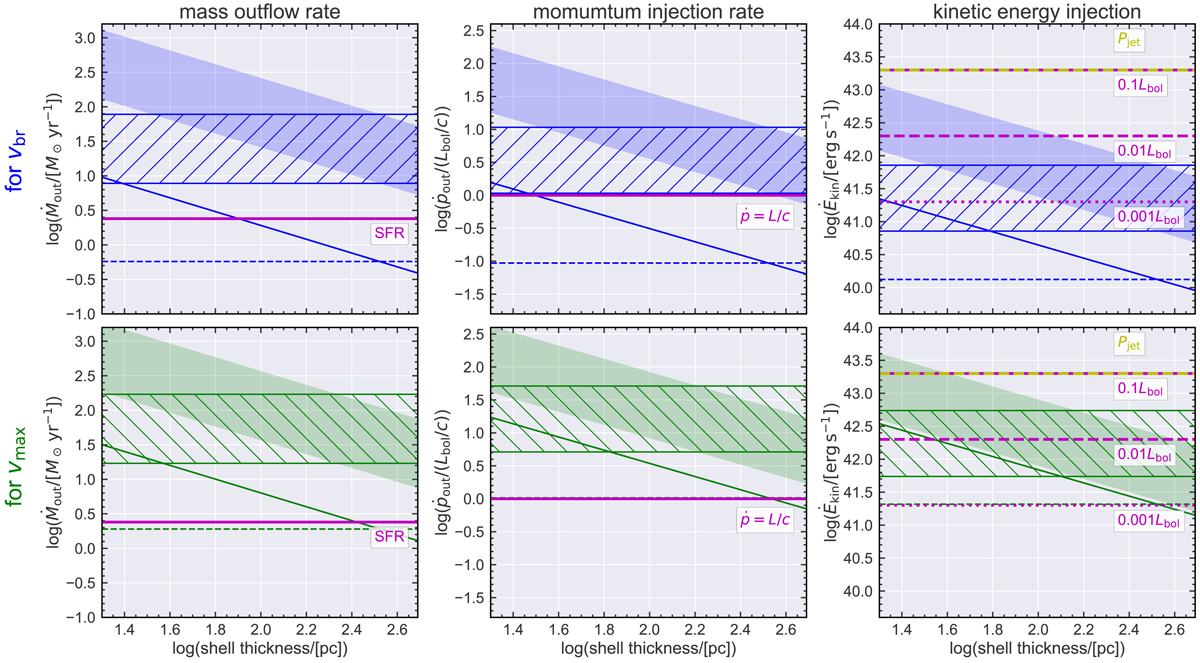
Mass outflow rate (left panel), momentum injection rate (middle panel) and kinetic energy injection rate (right panel) through a sphere at 1 kpc radius as a function of shell thickness. Measurements based on vbr and vmax are shown in top panels and bottom panels, respectively. Combined molecular+ionised gas measurements are shown as shaded (shell assumption) or hatched (cone assumption) areas highlighting the one order of magnitude uncertainty of XCO, while pure ionised gas mass computations results are represented by solid lines (shell assumption) or dashed lines (cone assumption). For comparison, the magenta lines highlight the SFR of the entire galaxy from the FIR measurements in the left panel, the point where Lbol/c = ṗout in the middle panel, and the fraction of Lbol at 10% (solid line), 1% (dashed line) and 0.1% (dotted line) as well as the jet power Pjet (yellow dashed line) in the right panel.
Current usage metrics show cumulative count of Article Views (full-text article views including HTML views, PDF and ePub downloads, according to the available data) and Abstracts Views on Vision4Press platform.
Data correspond to usage on the plateform after 2015. The current usage metrics is available 48-96 hours after online publication and is updated daily on week days.
Initial download of the metrics may take a while.