Fig. 11.
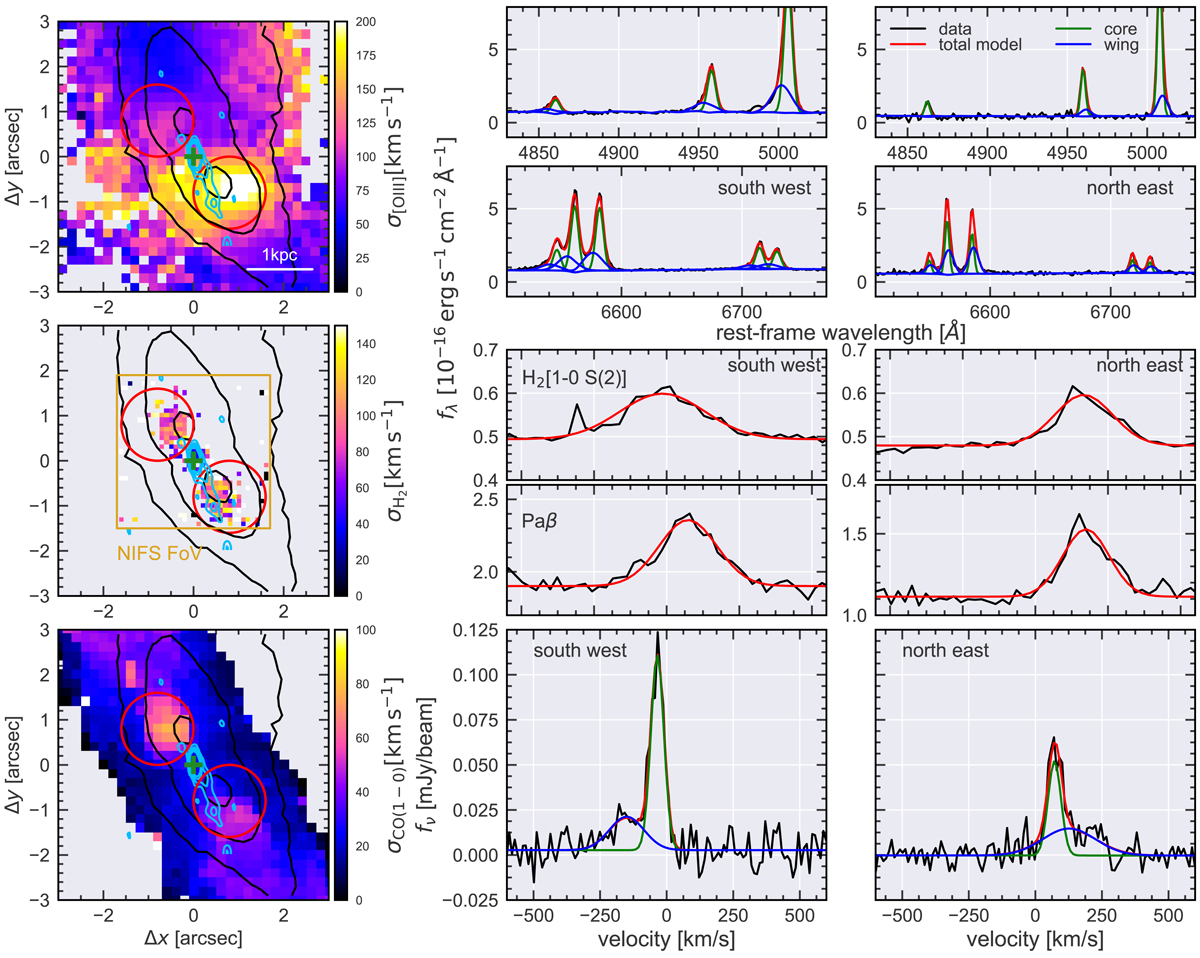
Left panels: velocity dispersion maps for the [O III], H2[1-0 S(2)], and CO(1-0) emission lines (assuming a single Gaussian LOSVD) in the central 5″×5″ (∼3.5 kpc × 3.5 kpc) for [O III], H2 and CO(1-0). The black contours indicate the [OIII] surface brightness distribution as a reference in all maps. The green cross marks the position of the AGN and the light blue contours represent the distribution of 10 GHz radio continuum emission as resolved with our VLA radio interferometric observations. The red circles indicates a circular aperture of 0.8″ in radius, which we use to extract spectra covering the two high dispersion region located south west and north east of the nucleus. Middle and right panels: spectra of the high dispersion regions in various emission lines from the optical, NIR and sub-mm observations for the south-west (middle) and north-east region (right). Most emission lines reveal an asymmetry towards the blue or red side that we model with two Gaussian line components, which we refer to as the core and wing component. Only Paβ and H2[1-0 S(2)] can be well-described by only a single Gaussian component.
Current usage metrics show cumulative count of Article Views (full-text article views including HTML views, PDF and ePub downloads, according to the available data) and Abstracts Views on Vision4Press platform.
Data correspond to usage on the plateform after 2015. The current usage metrics is available 48-96 hours after online publication and is updated daily on week days.
Initial download of the metrics may take a while.