Fig. 10.
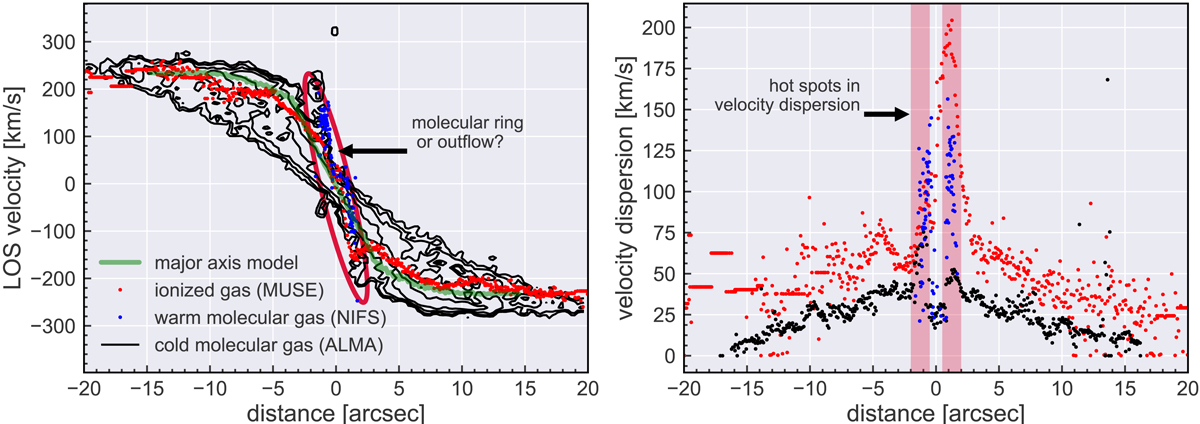
Position-velocity (left panel) and position-dispersion (right panel) diagrams along the major axis of HE 1353−1917. The black contours are for the cold molecular gas and the colored data points are the curves for the ionised and the warm molecular phase where the latter is limited by the much smaller NIFS FoV. The maximum velocity curve from the best-fit MGE model prediction is shown in the PV diagram on the left. Within the central 3″ we detect significant deviation from the PVD model (left), which may be related either to a galaxy ring structure of a bipolar outflow. “Hot spots” with an excess in velocity dispersion (right) are found on both sides of the nucleus in the same region.
Current usage metrics show cumulative count of Article Views (full-text article views including HTML views, PDF and ePub downloads, according to the available data) and Abstracts Views on Vision4Press platform.
Data correspond to usage on the plateform after 2015. The current usage metrics is available 48-96 hours after online publication and is updated daily on week days.
Initial download of the metrics may take a while.