Fig. 1.
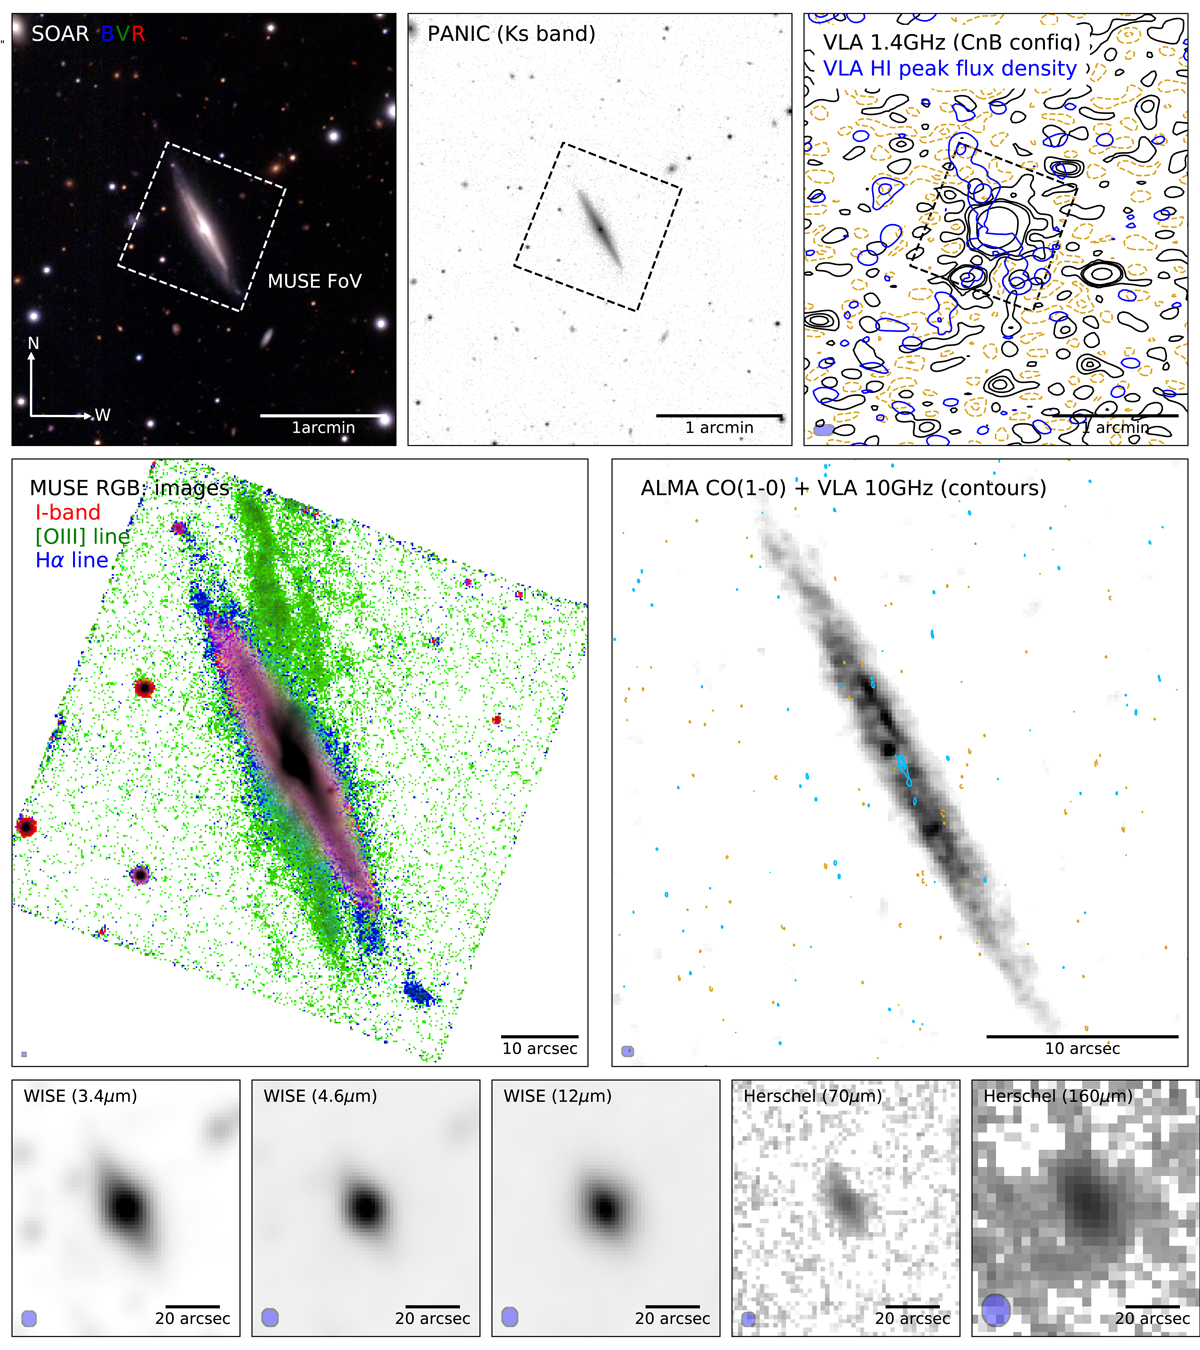
Multi-wavelength overview of HE 1353−1917. Top panels: SOAR optical BVR composite image, PANIC NIR Ks band image and a VLA L-band (1.4 GHz) continuum as contours covering a FoV of 3′×3′ (∼130 kpc × 130 kpc) centred on the galaxy. For the L-band we display 1, 3, 5, and 25σ levels as positive (solid black lines) and negative contours (dashed golden lines). We also show the peak flux density in the H I frequency range at 1.3 and 2 mJy levels indicating roughly the location of the atomic gas along the galaxy disc. The black dashed box indicates the orientation and position of the MUSE field-of-view (FoV). Middle panels: color composite image is shown on the left side based on a narrow-band [O III], Hα filter, and an I band filter reconstructed from the 1′×1′ MUSE observation. The CO(1-0) flux map observed with ALMA is shown on the right side where the 10 GHz VLA continuum image is overplotted as 1, 3, and 5σ positive (blue lines), and negative (golden lines) contours. Bottom panels: NIR to FIR archival images from WISE and Herschel space observatories for the 3.4 μm to 160 μm wavelength range. Beam sizes are shown when applicable in the lower left corner for guidance in each panel.
Current usage metrics show cumulative count of Article Views (full-text article views including HTML views, PDF and ePub downloads, according to the available data) and Abstracts Views on Vision4Press platform.
Data correspond to usage on the plateform after 2015. The current usage metrics is available 48-96 hours after online publication and is updated daily on week days.
Initial download of the metrics may take a while.