Fig. 7.
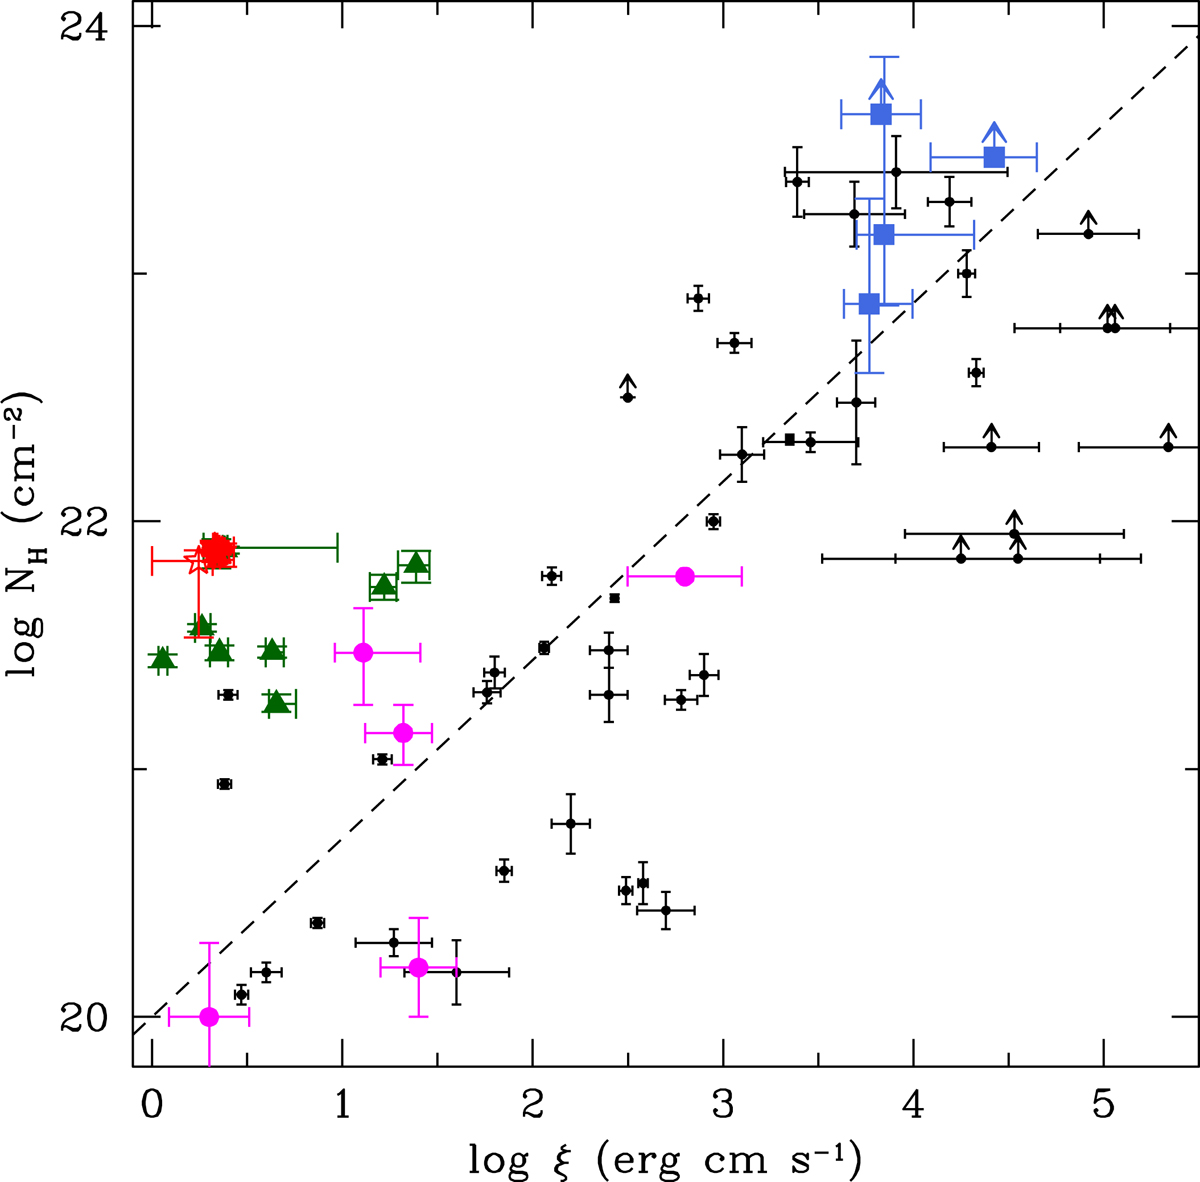
Column density vs. ionization parameter plot for WA (red stars), E-UFO (green triangles), and UFO (blue squares). Arrows represent lower limits on the column density, with the black dots and dashed line representing the linear fit from Tombesi et al. (2013). Magenta points are soft X-ray UFOs from the literature. This plot does not show any difference from Tombesi et al. (2013), since the E-UFO only differs from the WA in its velocity.
Current usage metrics show cumulative count of Article Views (full-text article views including HTML views, PDF and ePub downloads, according to the available data) and Abstracts Views on Vision4Press platform.
Data correspond to usage on the plateform after 2015. The current usage metrics is available 48-96 hours after online publication and is updated daily on week days.
Initial download of the metrics may take a while.