Fig. 5.
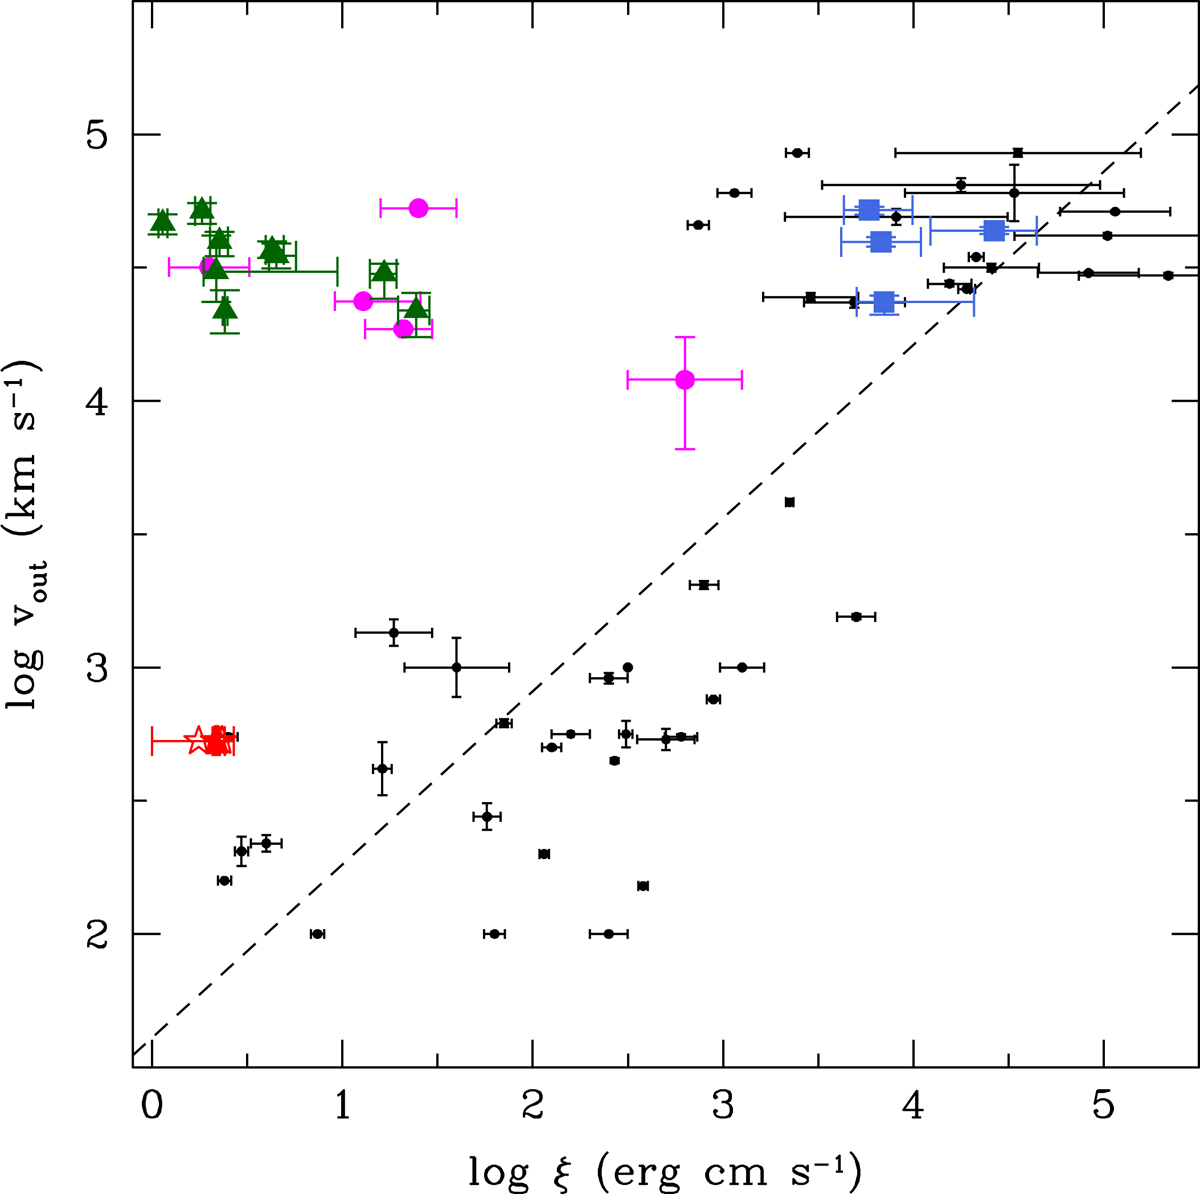
Velocity vs. ionization parameter plot for warm absorber (red stars), entrained ultra-fast outflow (green triangles), and ultra-fast outflow (blue squares). As expected, the UFO and the WA seem to follow a linear correlation. The smaller black points and the dashed line represent the points and the linear fit of Tombesi et al. (2013). The velocity of the WA constant to the value computed by Mathur et al. (1998) is v ∼ 530 km s−1. The E-UFO does not follow such a correlation. The magenta points represent other soft X-ray UFOs reported in the literature (see Sect. 1 for details).
Current usage metrics show cumulative count of Article Views (full-text article views including HTML views, PDF and ePub downloads, according to the available data) and Abstracts Views on Vision4Press platform.
Data correspond to usage on the plateform after 2015. The current usage metrics is available 48-96 hours after online publication and is updated daily on week days.
Initial download of the metrics may take a while.