Fig. 4.
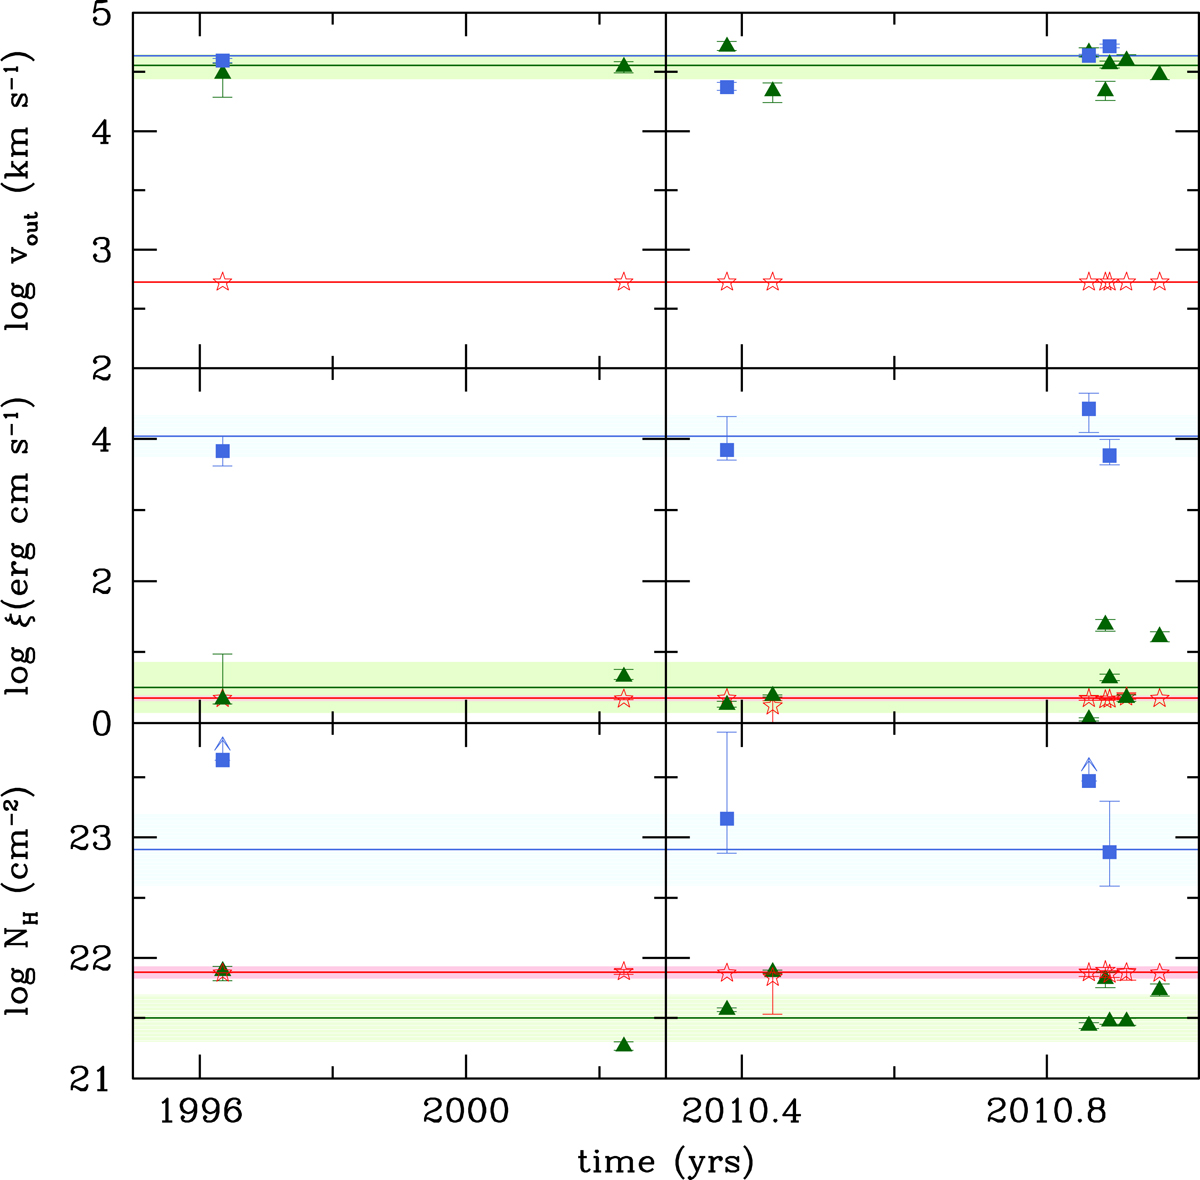
Time dependence of the outflow velocity vout (top), ionization parameter ξ (middle), and column density NH (bottom). For each panel we show the values of Abs. 1 (red stars), Abs. 2 (green triangles), and Abs. 3 (blue squares). Lower limits on NH were marked with an arrow. Horizontal lines with shaded bands represent the median values and the corresponding median absolute deviations.
Current usage metrics show cumulative count of Article Views (full-text article views including HTML views, PDF and ePub downloads, according to the available data) and Abstracts Views on Vision4Press platform.
Data correspond to usage on the plateform after 2015. The current usage metrics is available 48-96 hours after online publication and is updated daily on week days.
Initial download of the metrics may take a while.