Fig. 11
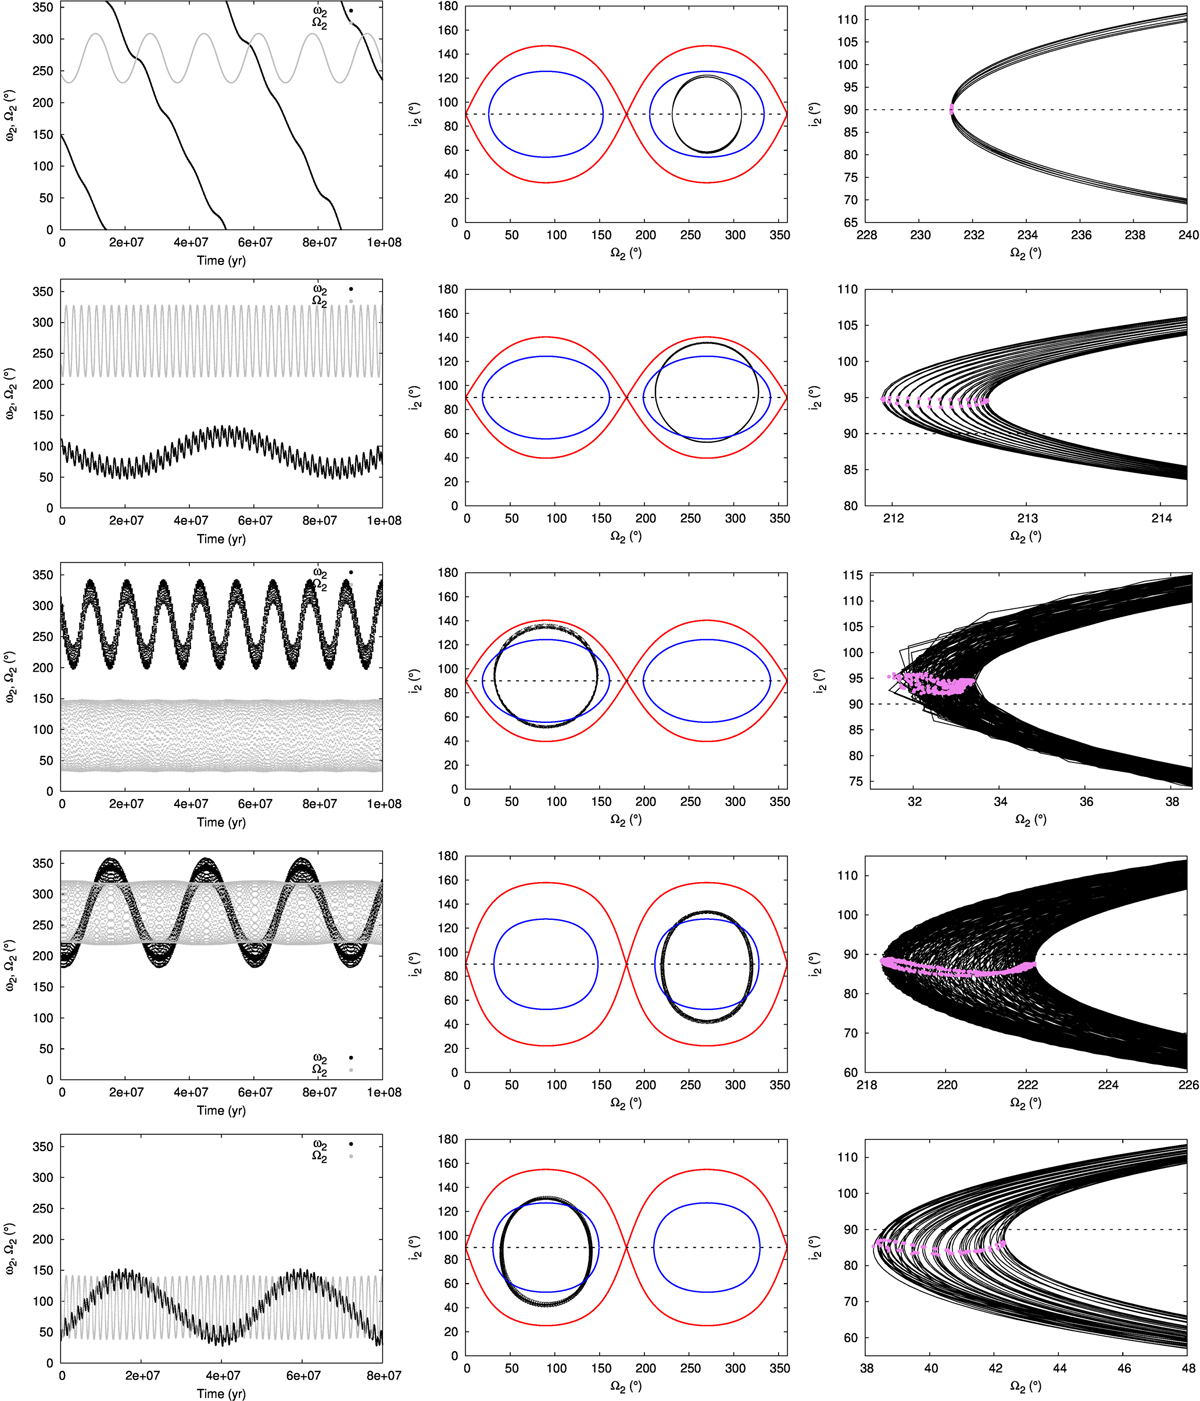
Evolution of different Type-F particles associated with Set 3 of N-body simulations. The rows are numbered from 1 to 5 from top to bottom. In every row, the black and gray curves of the left panel illustrate the evolution in time of ω2 and Ω2, respectively. Then, the black and red curves of the middle panel represent the trajectory of the particle and the separatrix in the plane (Ω2, i2), respectively, while the blue curve shows the pairs (Ω2, i2) of the particle’s trajectory that vanish the ω2 quadrupole precession rate of the system under consideration. Finally, the violet circles of the right panel illustrate the pairs (Ω2, i2) of the particle’s trajectory that vanish the Ω2 precession rate calculated up to the octupole level of the approximation. The initial orbital parameters of the test particles and the values of a1 and e1 associated with the inner Jupiter-mass planet are specified for every row in Table 1.
Current usage metrics show cumulative count of Article Views (full-text article views including HTML views, PDF and ePub downloads, according to the available data) and Abstracts Views on Vision4Press platform.
Data correspond to usage on the plateform after 2015. The current usage metrics is available 48-96 hours after online publication and is updated daily on week days.
Initial download of the metrics may take a while.