Fig. 10.
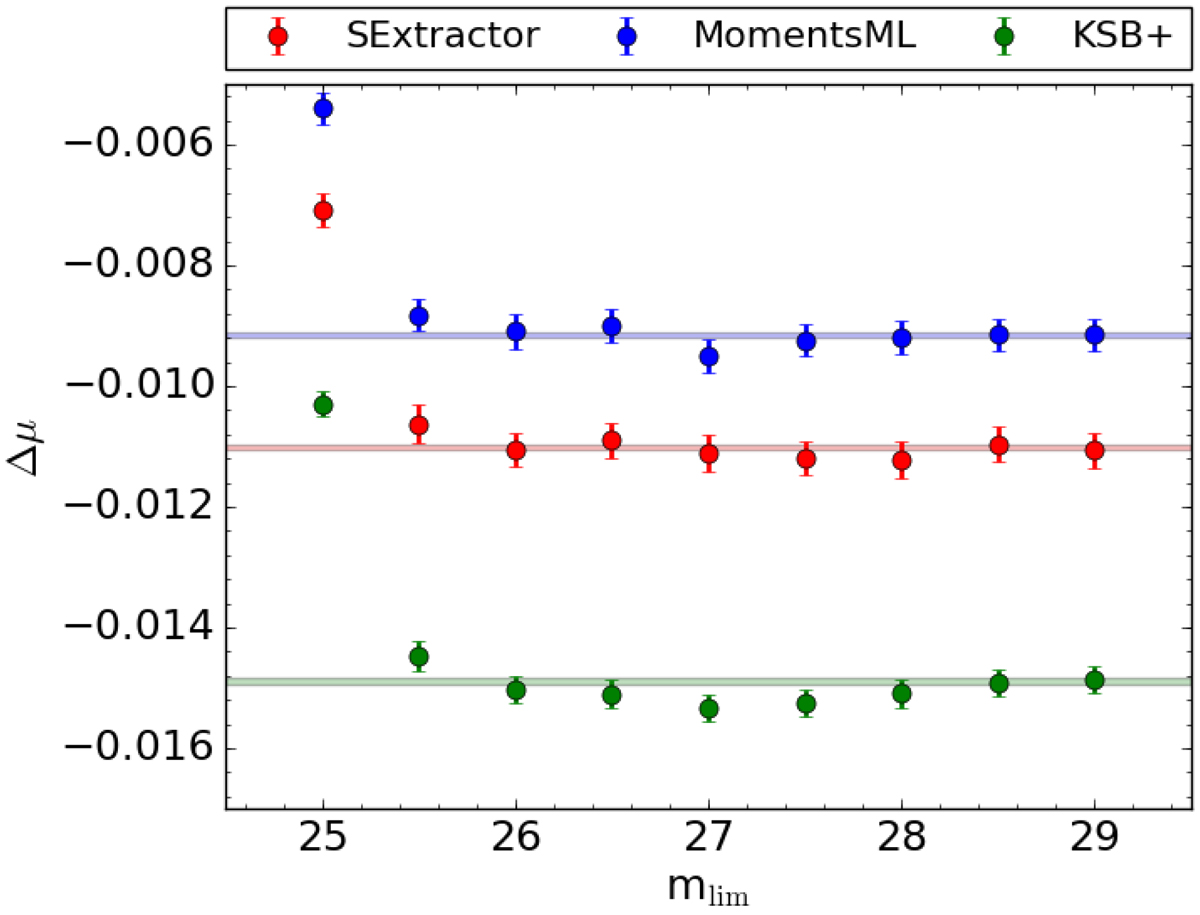
Shift in the multiplicative bias due to the presence of the faint galaxies up to the limiting magnitude given on the x-axis, when including the clustering of the faint galaxies. Red, blue, and green dots represent the SExtractor/PSFEx, MomentsML, and KSB+ measurements, respectively. The shaded regions correspond to a 10−4 variation in μ, centered between the values of the two deepest limiting magnitudes for each method. Every point corresponds to 20 million shear measurements.
Current usage metrics show cumulative count of Article Views (full-text article views including HTML views, PDF and ePub downloads, according to the available data) and Abstracts Views on Vision4Press platform.
Data correspond to usage on the plateform after 2015. The current usage metrics is available 48-96 hours after online publication and is updated daily on week days.
Initial download of the metrics may take a while.