Fig. 10.
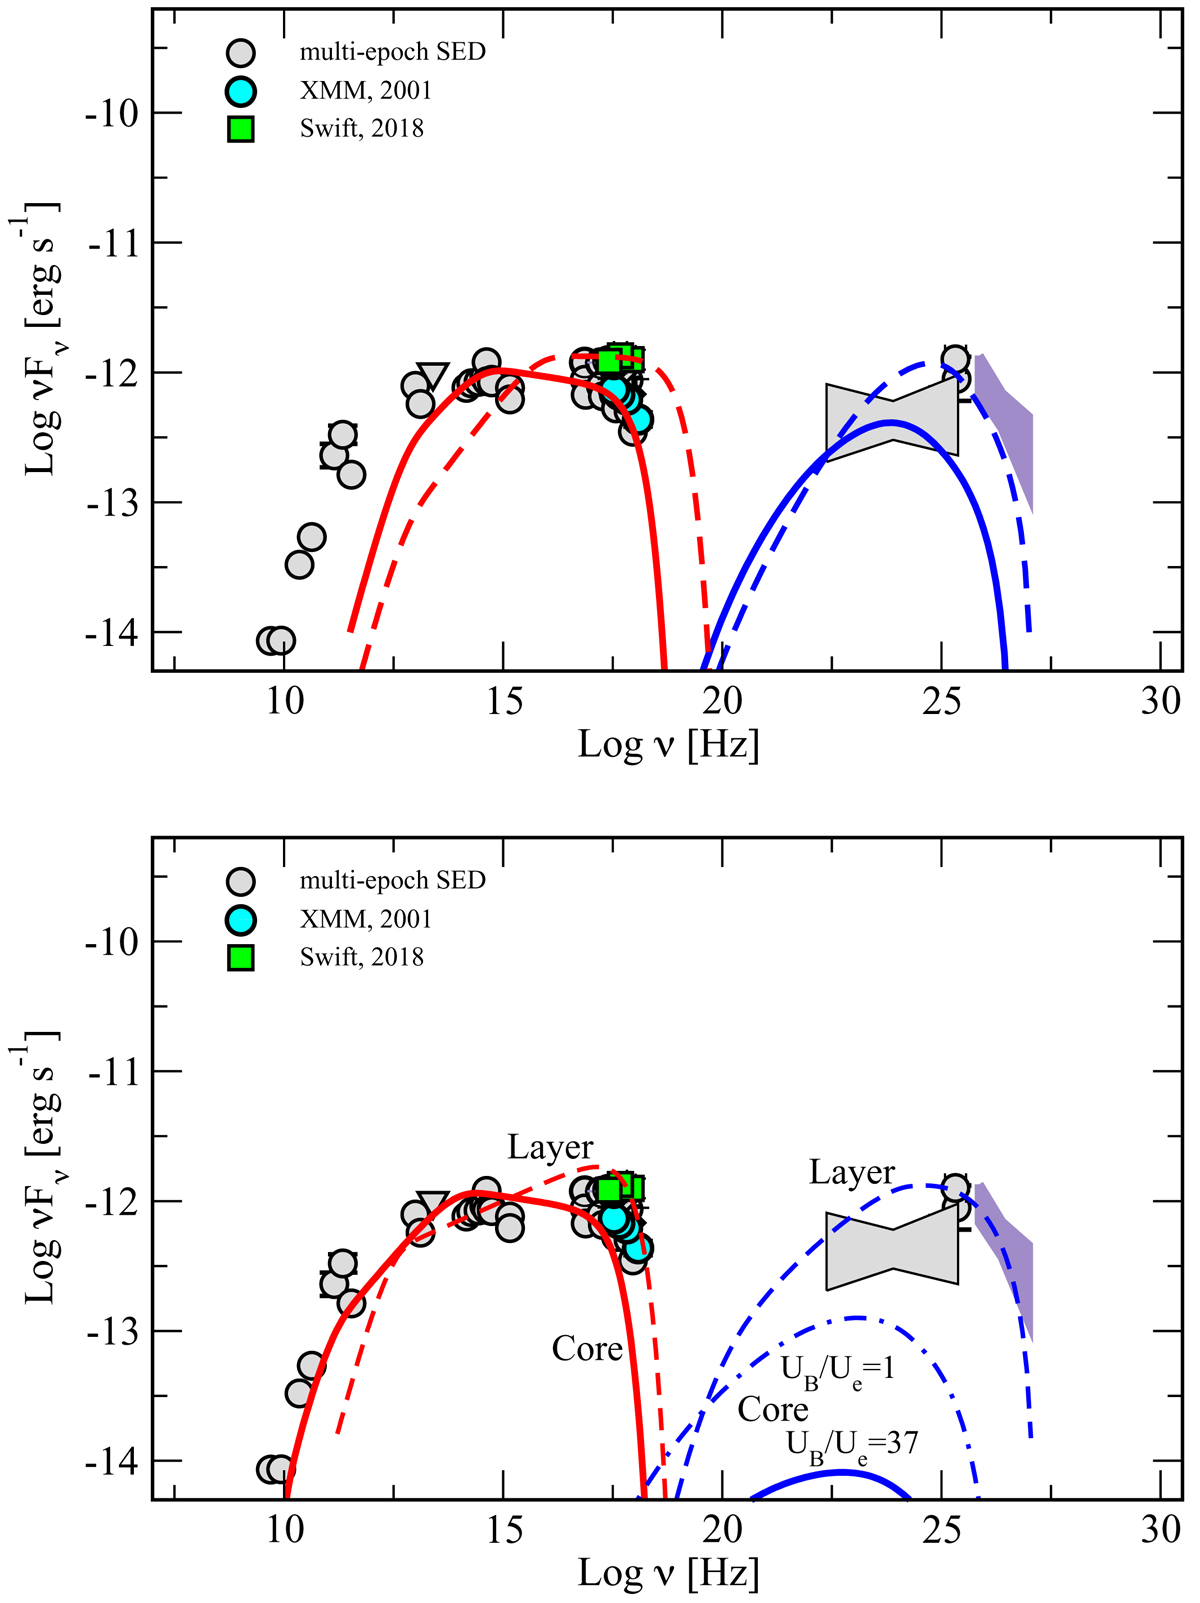
Observed SED of 3C 264 and models. Multi-epoch gray points were retrieved from publicly available databases (NED, ASDC). References for the fluxes are: Lara et al. (2004), Quillen et al. (2003) for the radio and microwave data, Leipski et al. (2009) for infrared data, and Chiaberge et al. (1999, 2002) for the optical-UV. The X-ray points are from this paper, while the γ-ray data are from the 3FGL and 3FHL catalogs (Ackermann et al. 2015; Ajello et al. 2017). The TeV spectrum was derived assuming a power law photon index ranging between 2.3 and 2.8 (Rieger & Levinson 2018) and a flux above 300 GeV as reported by Mukherjee (2018). Upper panel: SLS (solid red line for the synchrotron curve and blue line for the SSC component) and HHS (dashed red and blue lines) are both produced by an emitting region in the core (Model 1), still within the acceleration region. A large particle dominance is required to reach the observed γ-ray fluxes. Lower panel: emission of the SLS and HHS are produced in two different regions, in the core and in the layer, respectively (Model 2). This time, the core region is assumed to be Poynting-flux-dominated (UB/Ue = 37). The SSC emission of the core component (solid blue line) is significantly below the observed γ-ray emission, and remains such when equipartition between particles and magnetic field is assumed (dot-dashed line). The HHS originates in a region in the layer at the end of the acceleration region, moving with a bulk motion Γbulk ∼ 5.
Current usage metrics show cumulative count of Article Views (full-text article views including HTML views, PDF and ePub downloads, according to the available data) and Abstracts Views on Vision4Press platform.
Data correspond to usage on the plateform after 2015. The current usage metrics is available 48-96 hours after online publication and is updated daily on week days.
Initial download of the metrics may take a while.