Open Access
Fig. 8
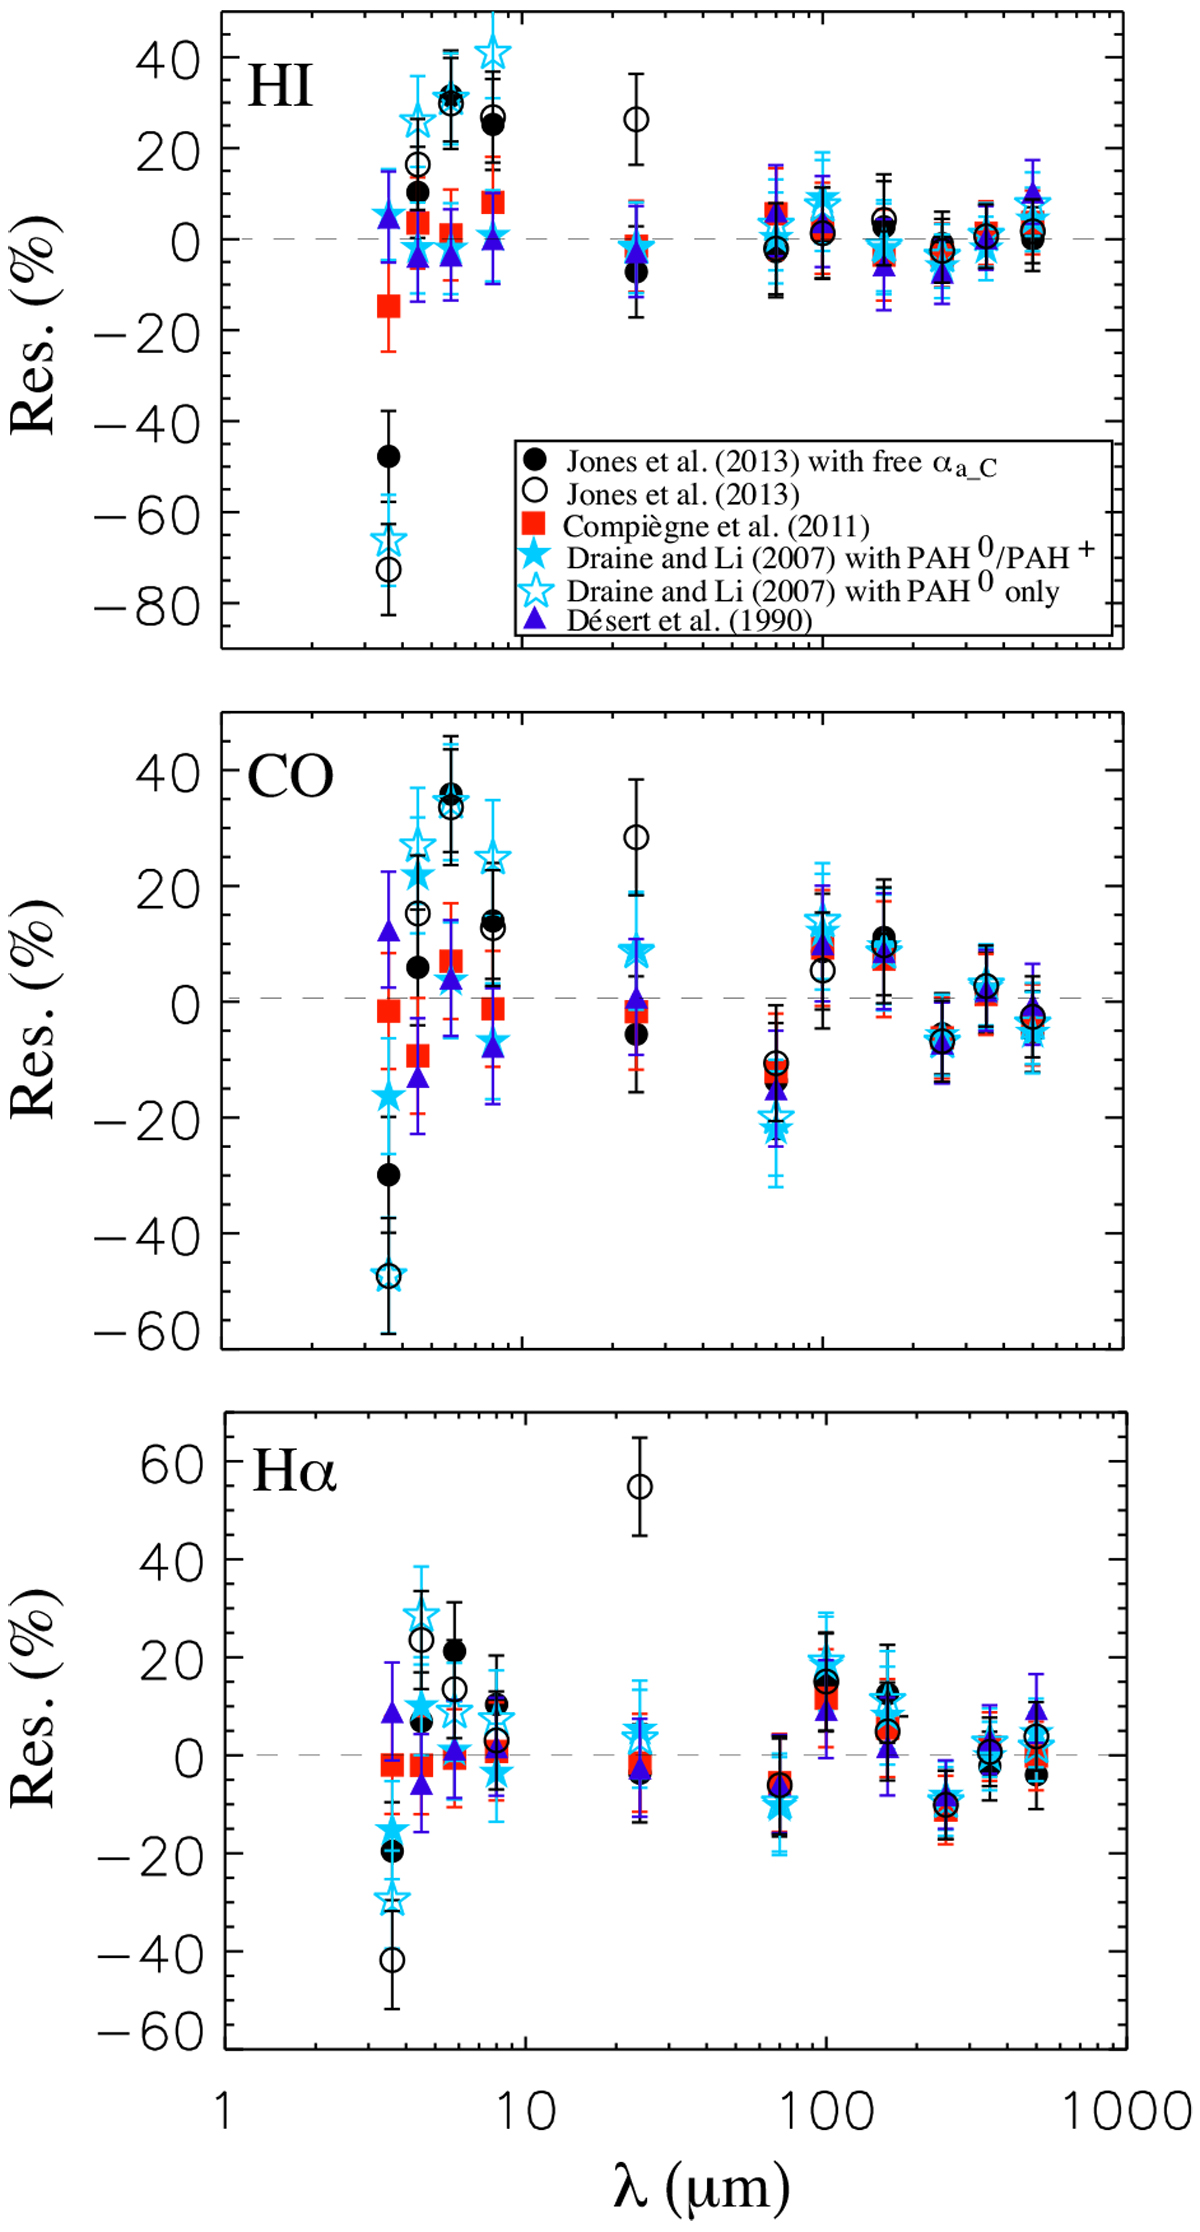
Average residuals A1 based on Gaussian fits (![]() ) of histograms presented in Figs. 4–7 and summarized in Table 1, as a function of wavelength. Error bars correspond to the data calibration uncertainties (10% for Spitzer and Herschel/PACS data, and 7% for Herschel/SPIRE data). The dashed line shows the absence of residual (0%).
) of histograms presented in Figs. 4–7 and summarized in Table 1, as a function of wavelength. Error bars correspond to the data calibration uncertainties (10% for Spitzer and Herschel/PACS data, and 7% for Herschel/SPIRE data). The dashed line shows the absence of residual (0%).
Current usage metrics show cumulative count of Article Views (full-text article views including HTML views, PDF and ePub downloads, according to the available data) and Abstracts Views on Vision4Press platform.
Data correspond to usage on the plateform after 2015. The current usage metrics is available 48-96 hours after online publication and is updated daily on week days.
Initial download of the metrics may take a while.