Fig. 2
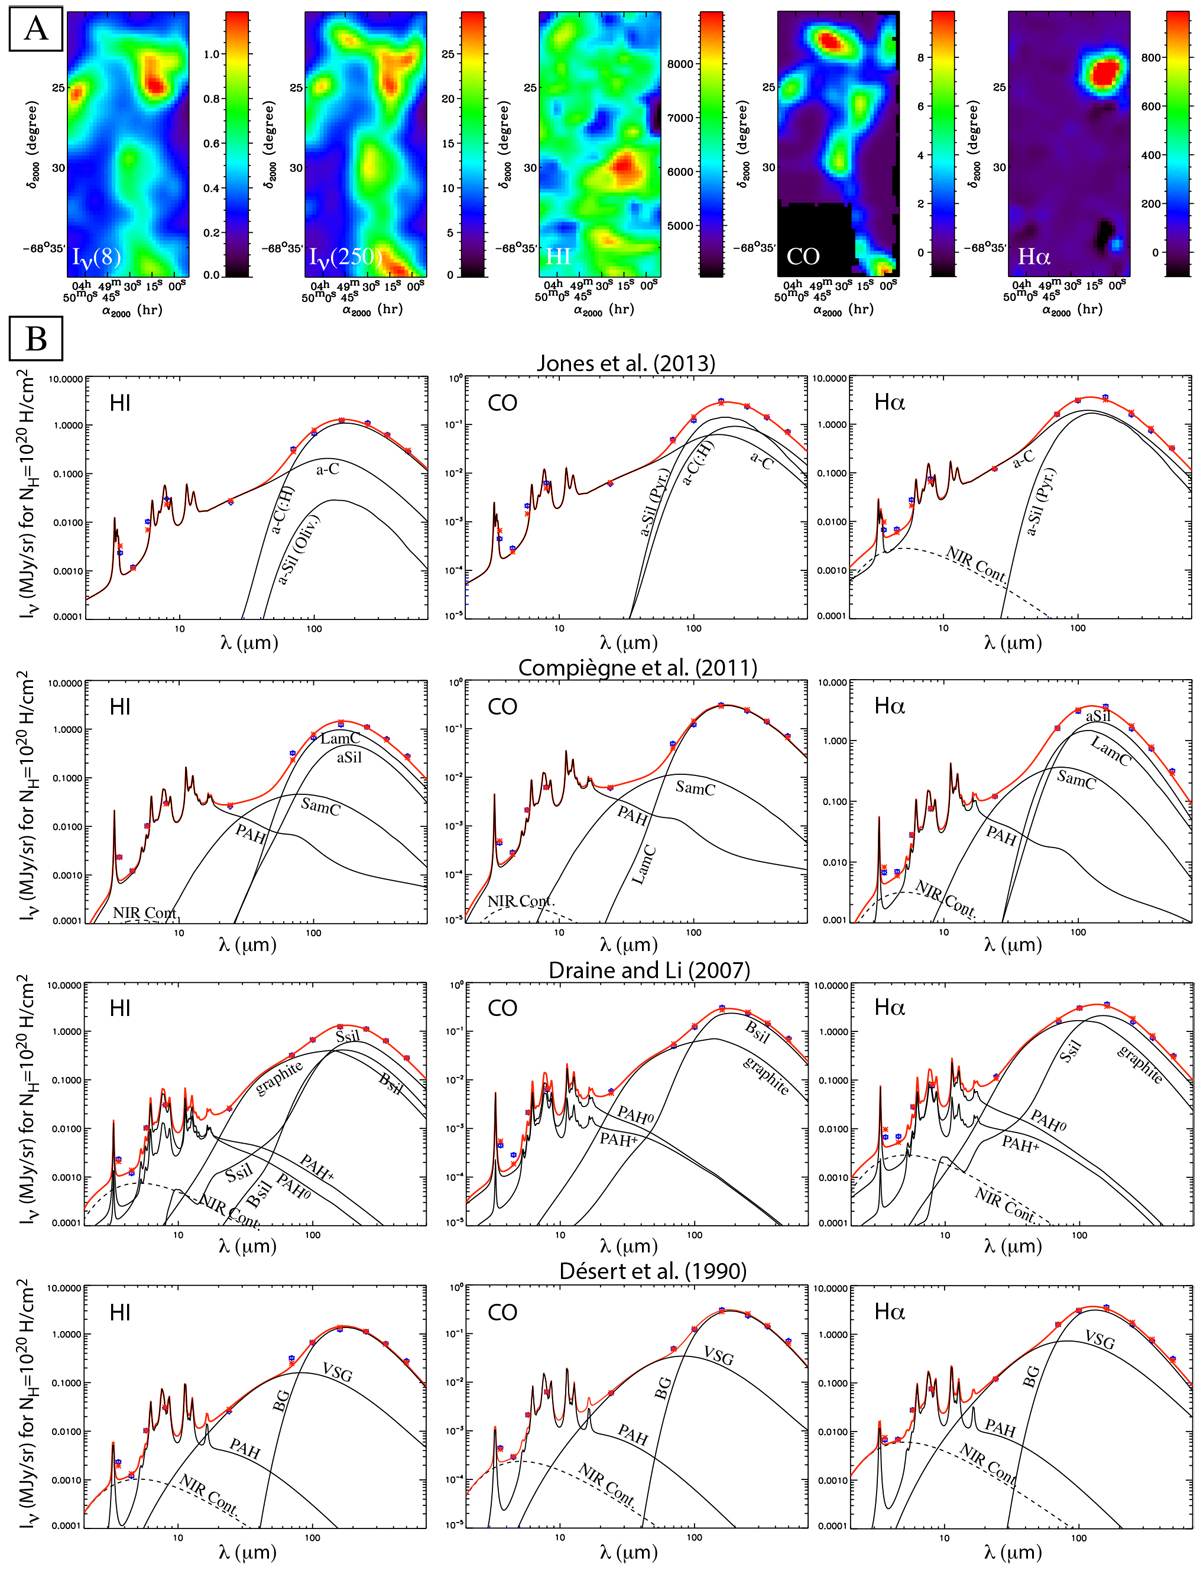
Panels A: maps of the dust emission (8 and 250 μm in MJy sr−1) and maps of the gas components (HI in Jy beam−1 km s−1, CO in K km s−1, Hα in dR) ofa molecular cloud of our sample (cloud number 5 in Fukui et al. 2008, nomenclature). Panels B: SEDs in the various gas phases derived from dust decomposition (see Eq. (3)) for cloud number 5, fitted with the different dust models. Blue diamonds correspond to the data with their 1σ uncertainties, whereas the red asterisks and the red continuous lines correspond to the color-corrected brightnesses and the total emission derived from the models.
Current usage metrics show cumulative count of Article Views (full-text article views including HTML views, PDF and ePub downloads, according to the available data) and Abstracts Views on Vision4Press platform.
Data correspond to usage on the plateform after 2015. The current usage metrics is available 48-96 hours after online publication and is updated daily on week days.
Initial download of the metrics may take a while.