Fig. A.2
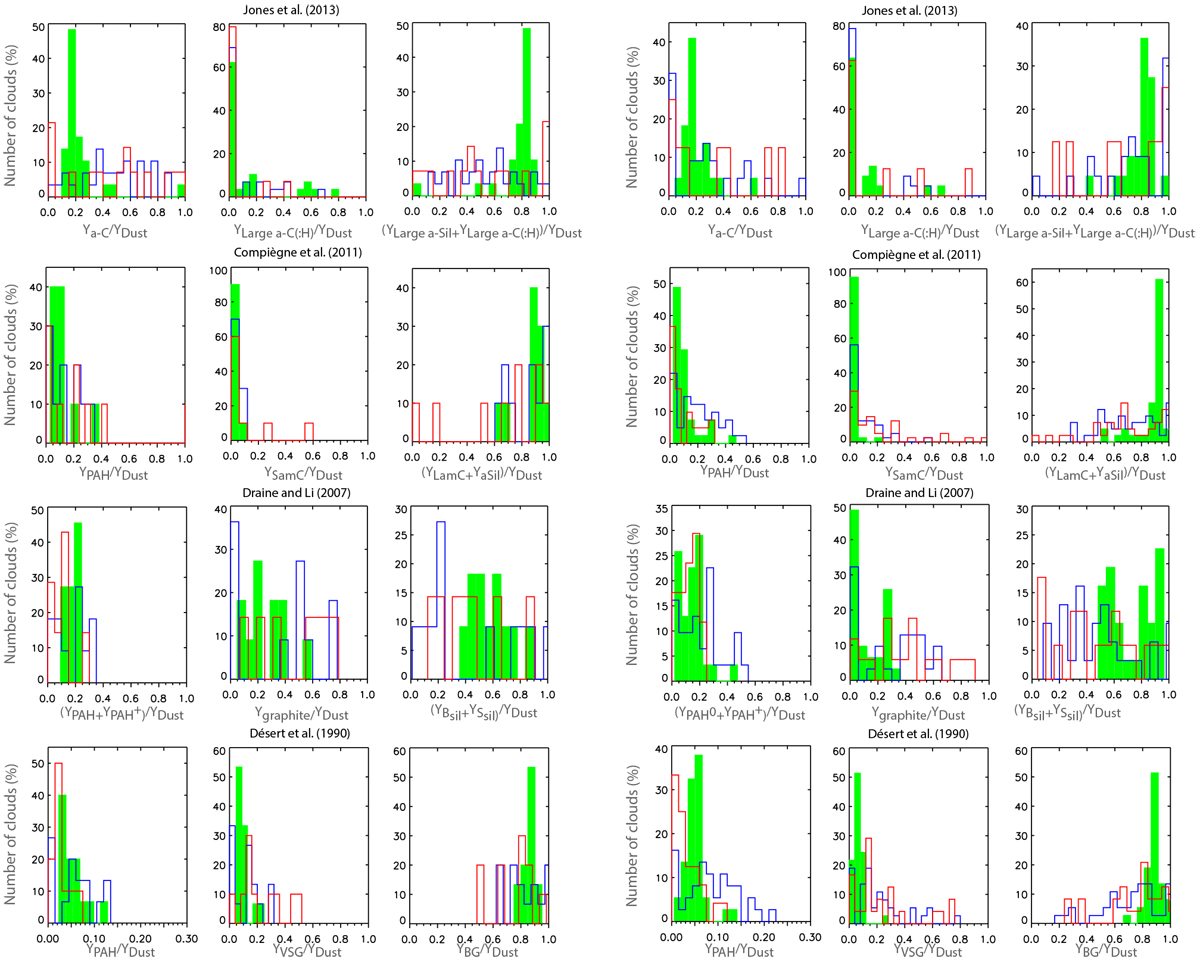
Histograms of the relative abundances of the dust components for clouds with similar dust temperatures in the atomic and molecular phases (case 1 as defined in Sect. 7.1) on the left, and for clouds with significantly colder dust temperatures in the molecular than in the atomic phases (case 2) on the right. The atomic, molecular, and ionized phases are shown in green, blue, and red, respectively. The dark gas phase has been taken into account in the decomposition of the dust emission (see Sect. 3). As evidenced in Fig. 11, we notice an enhancement of the PAH relative abundance in the molecular phase (as compared to the atomic phase) for clouds in case 2 as compared to clouds in case 1. The VSG relative abundance is also increased in the ionized phase in both cases, as well as in the molecular phase (that was not observed in Fig. 11).
Current usage metrics show cumulative count of Article Views (full-text article views including HTML views, PDF and ePub downloads, according to the available data) and Abstracts Views on Vision4Press platform.
Data correspond to usage on the plateform after 2015. The current usage metrics is available 48-96 hours after online publication and is updated daily on week days.
Initial download of the metrics may take a while.