Fig. A.1
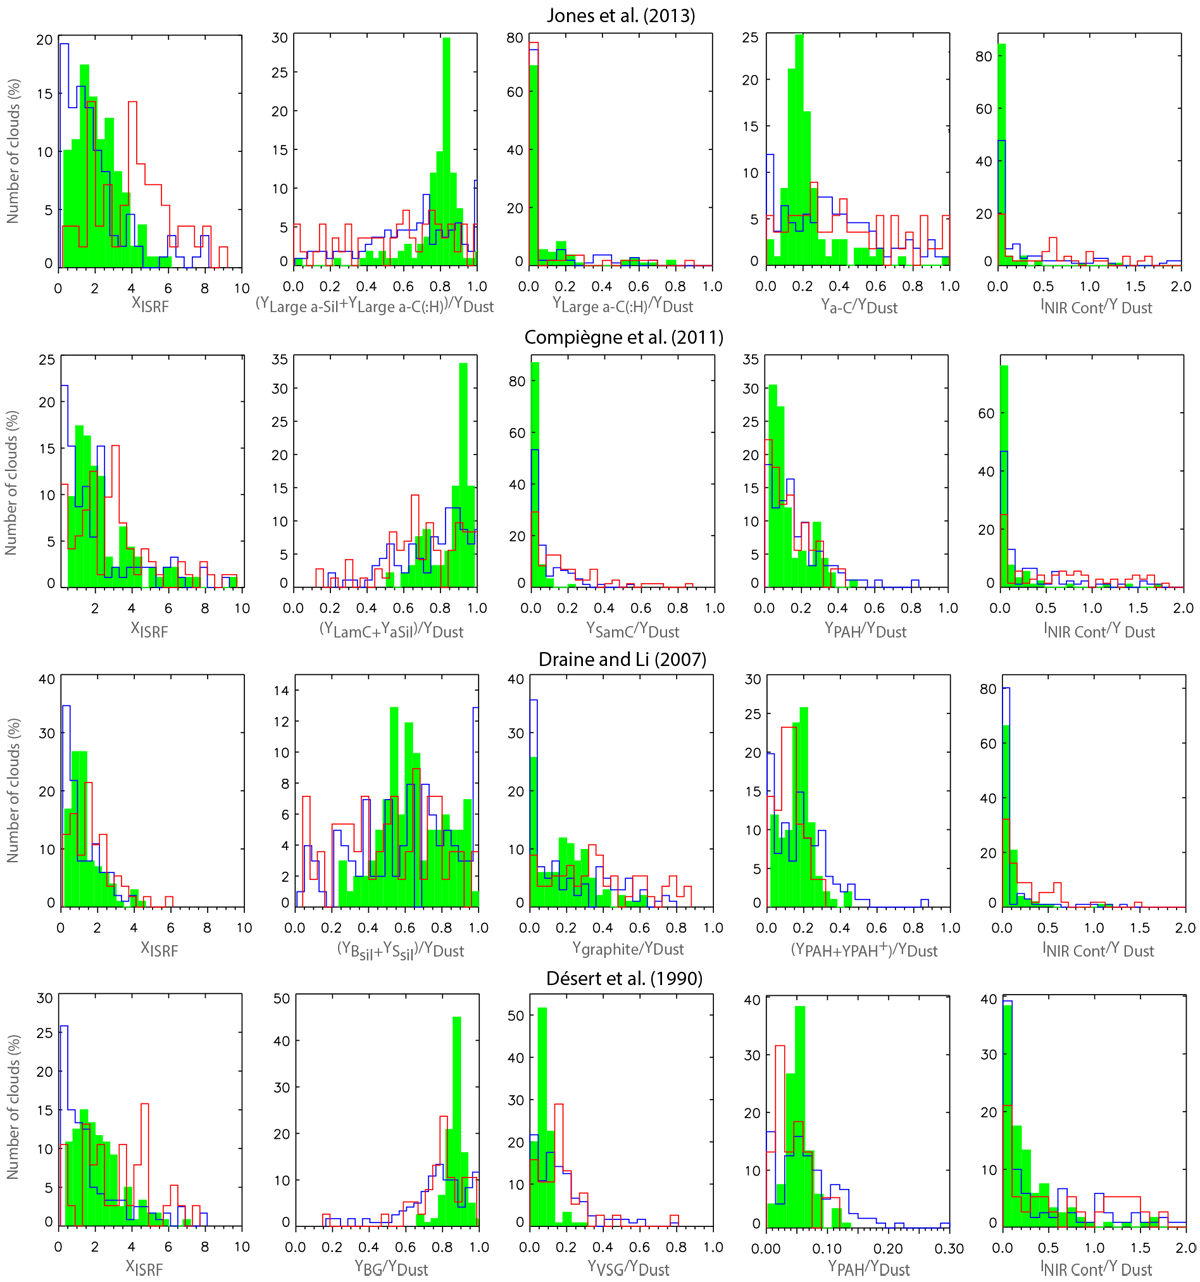
Histograms of the parameters derived for each dust model (relative dust abundances, intensity of the radiation field, and relative intensity of the NIR continuum, see Sect. 4.2) in the different gas phases (atomic in green, molecular in blue, and ionized in red), when including the dark gas phase in the decomposition of the dust emission (see Sect. 3). We observe the same trends as in Fig. 10: a decrease of the intensity of the radiation field in the molecular phase and an increase in the ionized phase, as compared to the atomic phase; an increase of the PAH relative abundance in the molecular phase; an increase of the VSG relative abundance in the ionized phase and in the molecular one (that was not observed in Fig. 10); and a more extended distribution of the NIR continuum in the ionized phase as compared to the other phases.
Current usage metrics show cumulative count of Article Views (full-text article views including HTML views, PDF and ePub downloads, according to the available data) and Abstracts Views on Vision4Press platform.
Data correspond to usage on the plateform after 2015. The current usage metrics is available 48-96 hours after online publication and is updated daily on week days.
Initial download of the metrics may take a while.