Fig. 5.
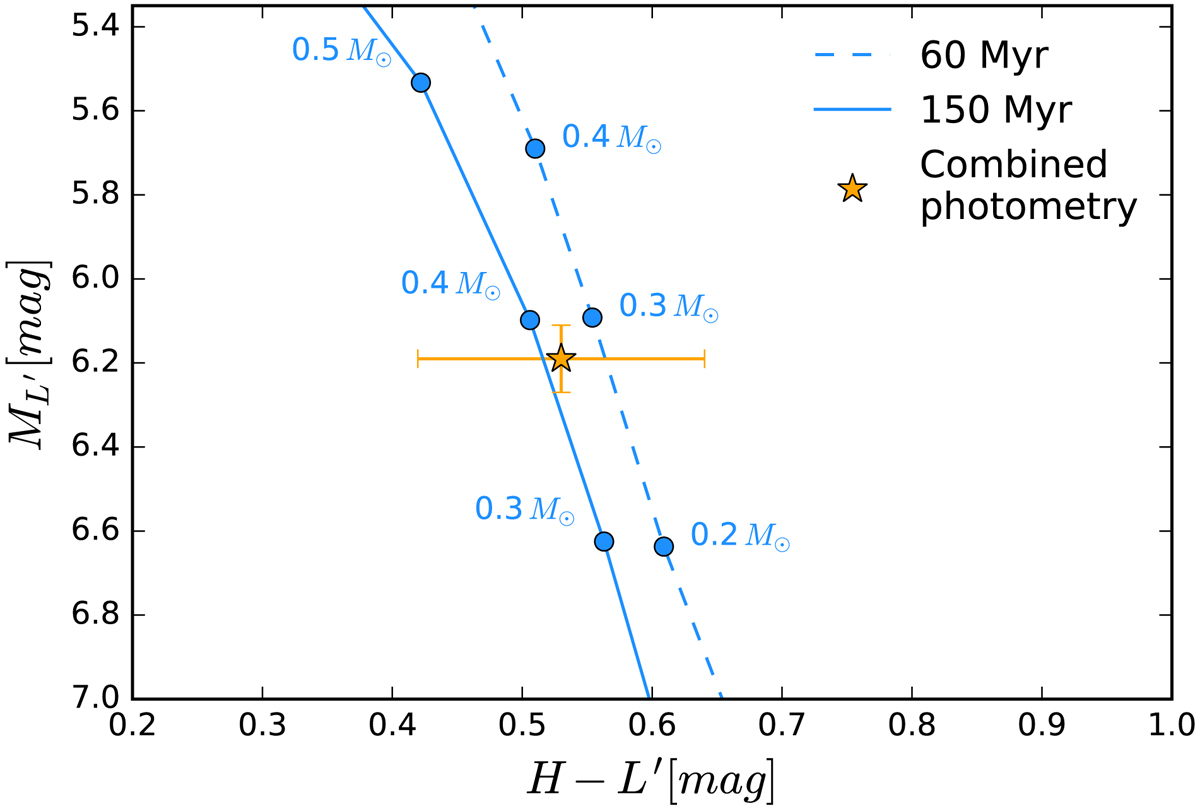
Colour-magnitude diagram showing the weighted mean L′-band magnitude derived from the 2016 and 2018 NaCo datasets, together with the H-band magnitude derived from the GPI dataset. We plot the evolutionary tracks for the BT-Settl models from Allard et al. (2012), for ages of 60 and 150 Myr. The photometry does not allow us to distinguish between the two age estimates.
Current usage metrics show cumulative count of Article Views (full-text article views including HTML views, PDF and ePub downloads, according to the available data) and Abstracts Views on Vision4Press platform.
Data correspond to usage on the plateform after 2015. The current usage metrics is available 48-96 hours after online publication and is updated daily on week days.
Initial download of the metrics may take a while.