Fig. 4.
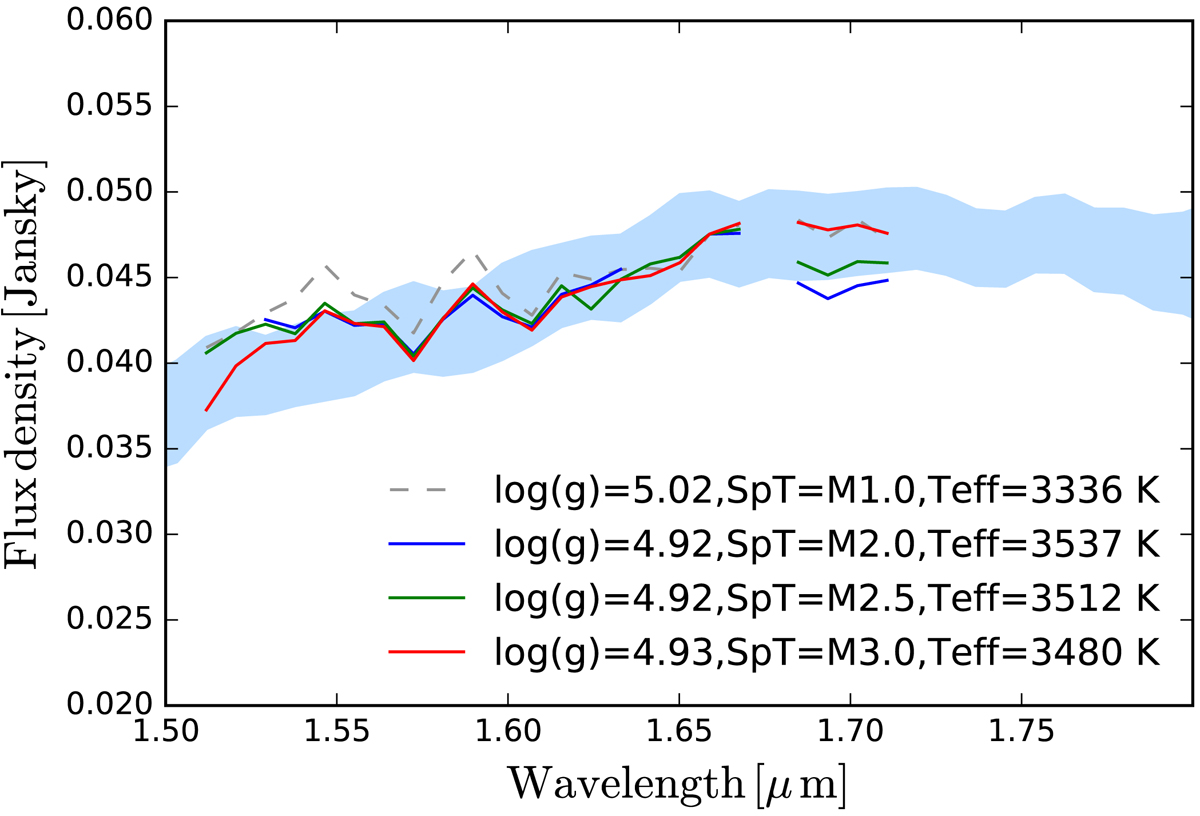
Comparison between the spectrum of the companion and observed spectra of early M dwarfs. The blue shaded area is the flux density of the companion in the GPI H-band, in Jansky. The spectrum is the weighted average of the spectra extracted from the 76 GPI datacubes and the area encompass the uncertainties (derived from the uncertainty on the flux of the host star). The solid lines are three spectra from the CARMENES stellar spectral library, for various Teff and log g values (evaluated in Hintz et al. 2019) and the dotted grey line is an additional spectrum of an M1 object.
Current usage metrics show cumulative count of Article Views (full-text article views including HTML views, PDF and ePub downloads, according to the available data) and Abstracts Views on Vision4Press platform.
Data correspond to usage on the plateform after 2015. The current usage metrics is available 48-96 hours after online publication and is updated daily on week days.
Initial download of the metrics may take a while.