Fig. 1.
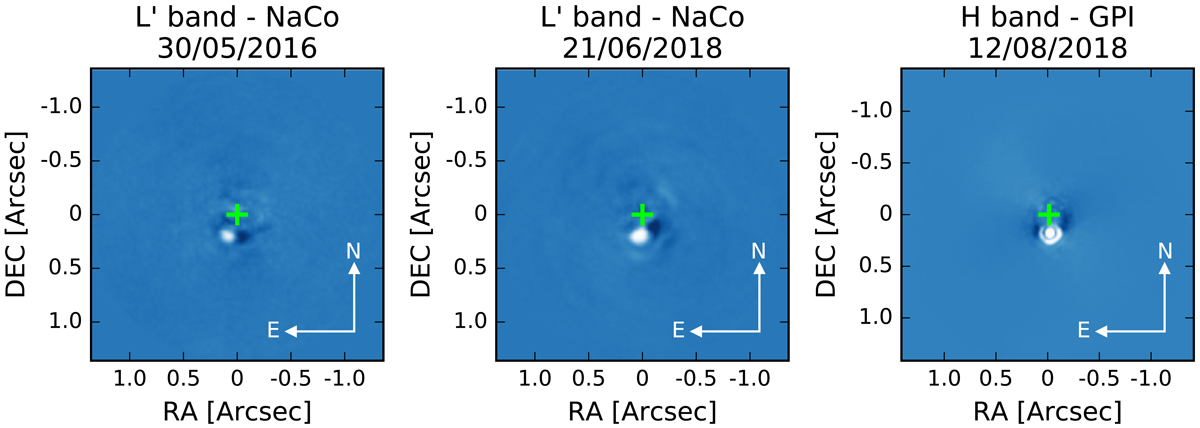
Classically ADI reduced images for the two NaCo datasets (left and centre) and for the GPI dataset (right). The images are oriented with north up and east left, and the green cross indicates the position of the central star. The companion is clearly visible close to the centre in all three datasets. The images are normalised and the colour map was chosen for a better visualisation of the data.
Current usage metrics show cumulative count of Article Views (full-text article views including HTML views, PDF and ePub downloads, according to the available data) and Abstracts Views on Vision4Press platform.
Data correspond to usage on the plateform after 2015. The current usage metrics is available 48-96 hours after online publication and is updated daily on week days.
Initial download of the metrics may take a while.