Fig. 8.
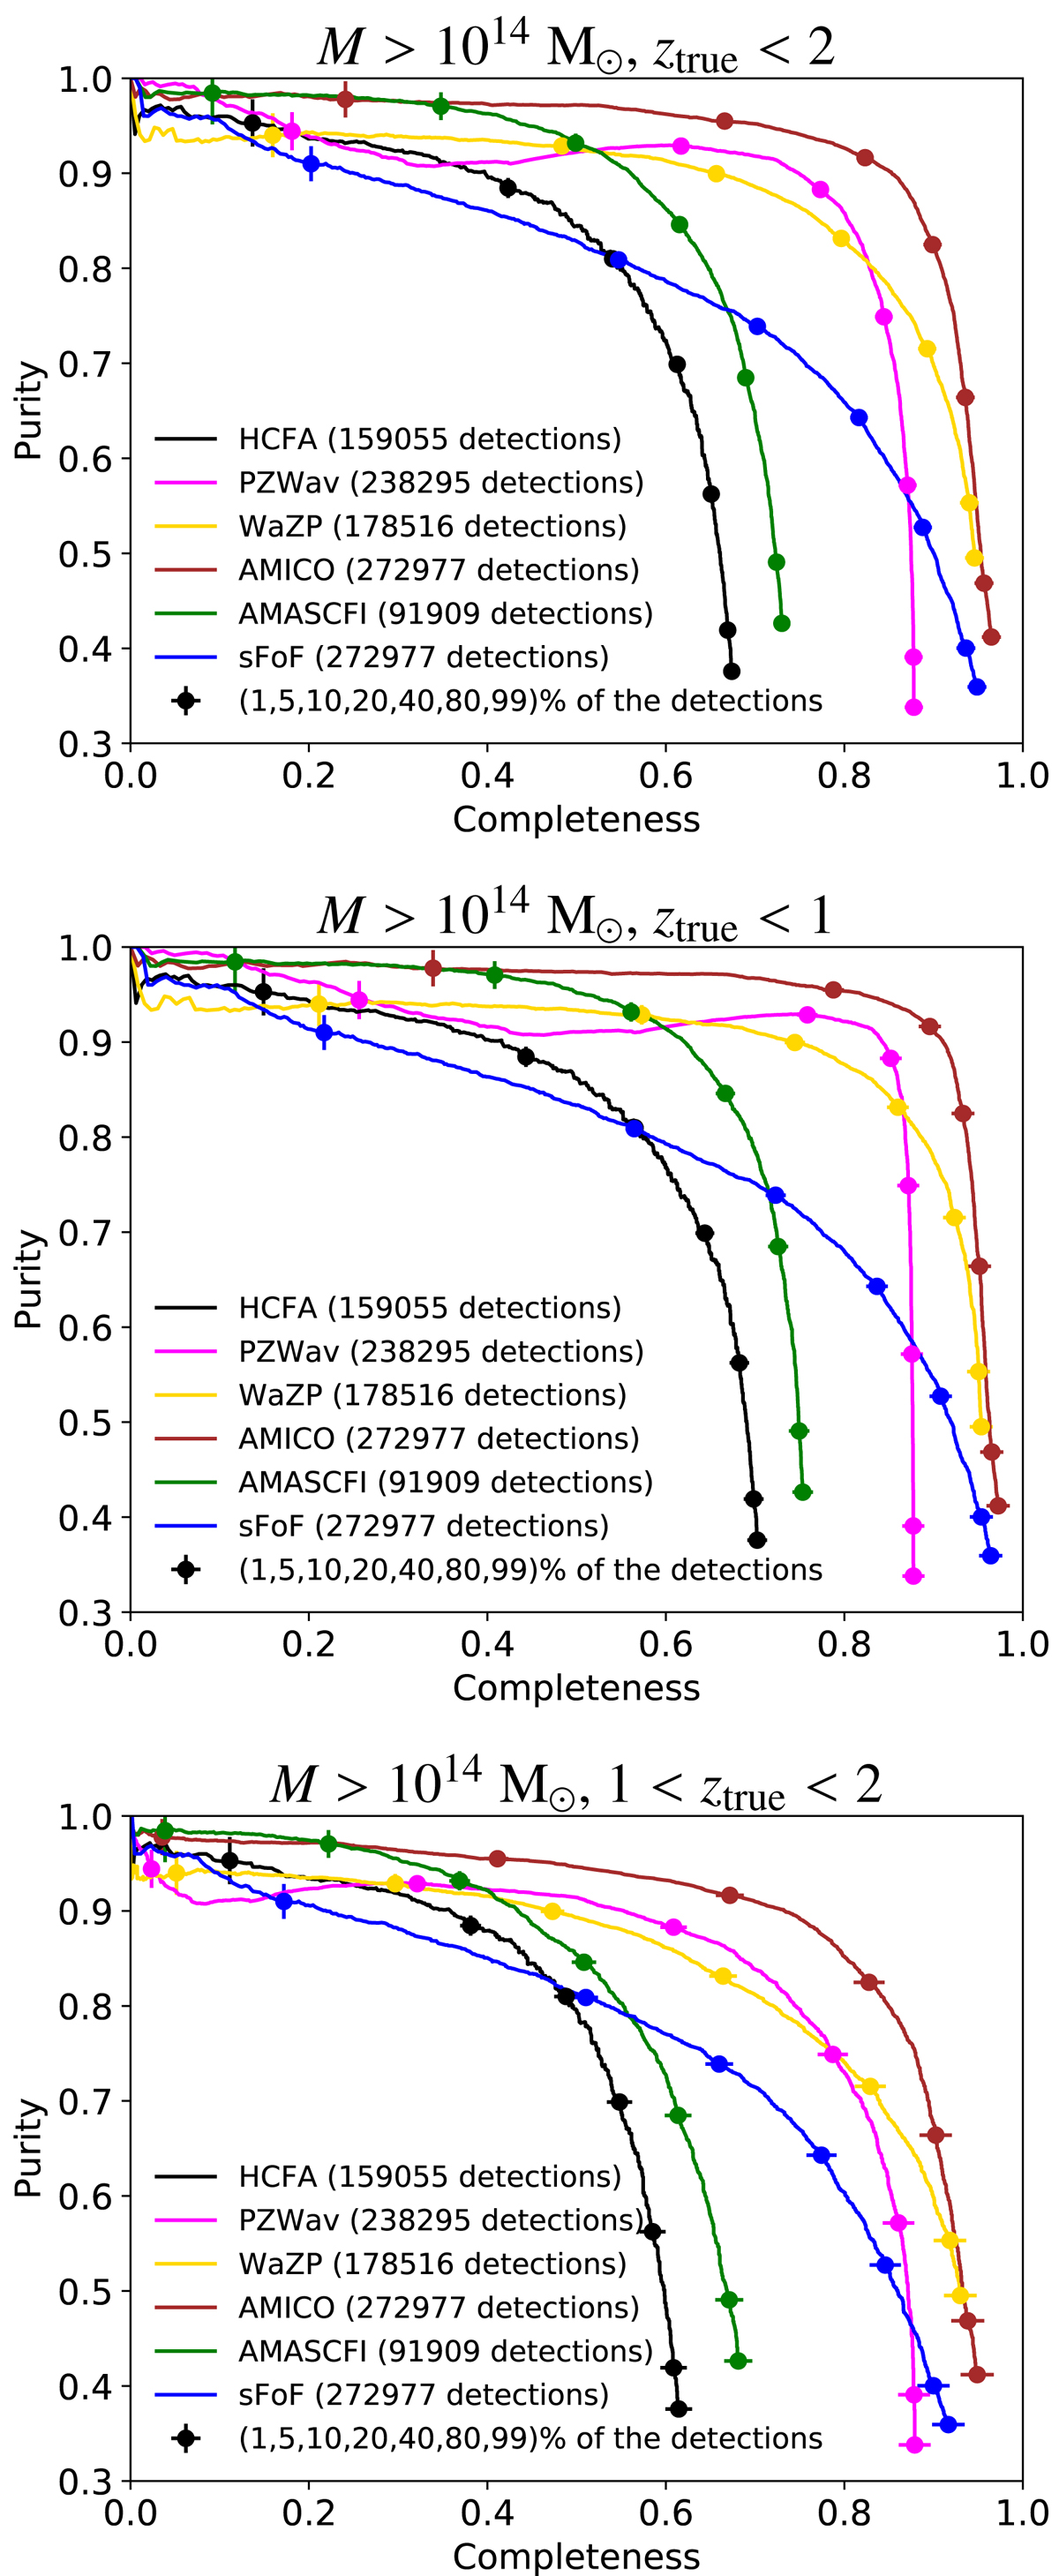
Purity as a function of completeness, given for all cluster finder catalogs as a function of the ranking of the detections. As the number of considered detections above a given rank increases, the detection properties evolve from the high purity low completeness regime to the low purity high completeness regime. The dots provide the percentage of considered detections at a given coordinate on the curve, the total number of detections being given in the legend for each finder. The top panel only accounts for mock clusters in the range ztrue < 2 and M > 1014 M⊙ when computing the completeness. For illustration, we also provide the same figure in the range ztrue < 1 and 1 < ztrue < 2 in the bottom panels.
Current usage metrics show cumulative count of Article Views (full-text article views including HTML views, PDF and ePub downloads, according to the available data) and Abstracts Views on Vision4Press platform.
Data correspond to usage on the plateform after 2015. The current usage metrics is available 48-96 hours after online publication and is updated daily on week days.
Initial download of the metrics may take a while.