Fig. 7.
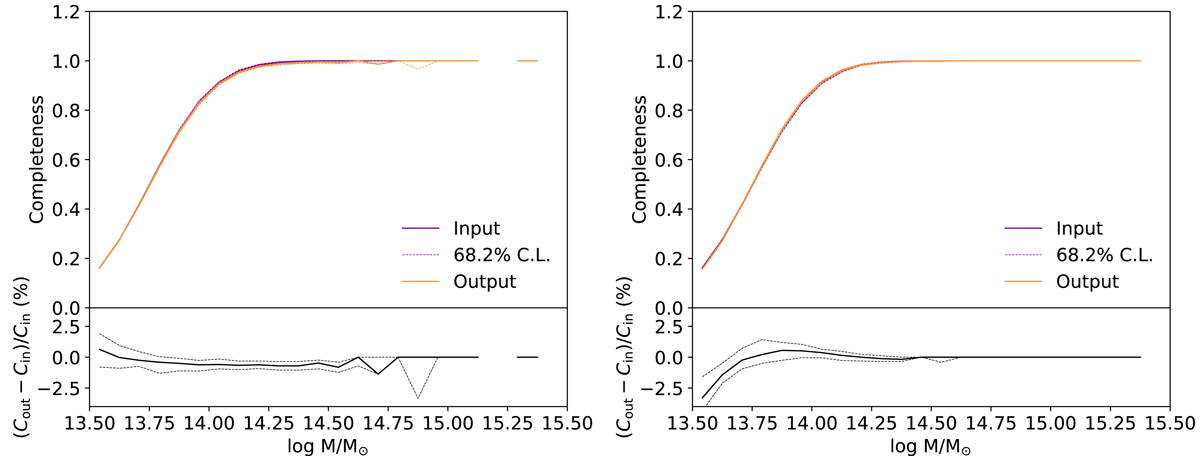
Comparison between the input completeness, as a function of mass, and the recovered completeness for the geometrical matching (left) and the ranking matching (right). The normalized residual is provided as the bottom plot. The dashed line provide the statistical uncertainty on the bias, computed as the 68.2% statistical limit over all the Monte Carlo realizations.
Current usage metrics show cumulative count of Article Views (full-text article views including HTML views, PDF and ePub downloads, according to the available data) and Abstracts Views on Vision4Press platform.
Data correspond to usage on the plateform after 2015. The current usage metrics is available 48-96 hours after online publication and is updated daily on week days.
Initial download of the metrics may take a while.