Fig. 5.
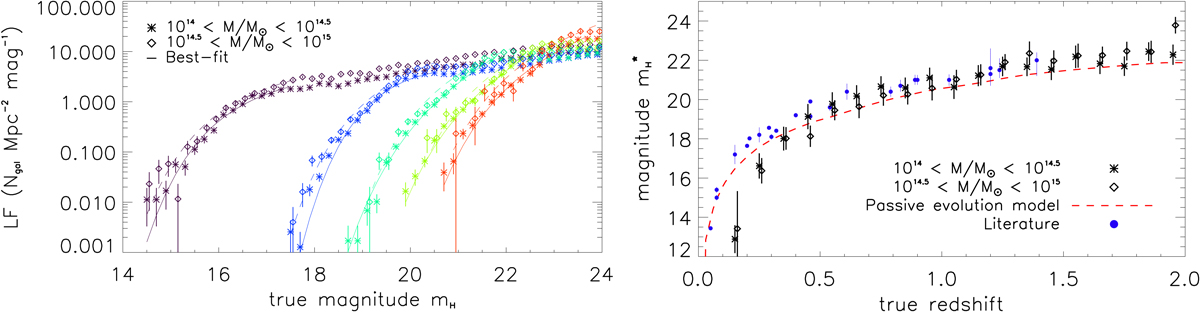
Left: stacked LF of cluster galaxies. The different colors indicate different redshift bins, of width 0.1, used to compute them. Only redshift bins centered on 0.15 (purple), 0.55 (blue), 0.95 (cyan), 1.35 (green) and 1.75 (red) are shown for clarity. As indicated in the legend, the star and diamond symbols correspond to the two mass bins, in the range 1014 − 1014.5 M⊙ and 1014.5 − 1015 M⊙, respectively. The solid and dashed lines provide the best-fit models of Eq. (3) in the bright magnitude regime, in the low and high mass bins, respectively. We note that in the high mass bin, the number of clusters per bin may be less than 10 at redshifts larger than 1.5, and reaches 2 in the last bin. Right: redshift evolution of the parameter ![]() , for each mass bin using similar symbols, and comparison to the passive evolution model, as the red dashed line, from Fioc & Rocca-Volmerange (1997), and calibrated using the work by Lin et al. (2006). The blue points indicate
, for each mass bin using similar symbols, and comparison to the passive evolution model, as the red dashed line, from Fioc & Rocca-Volmerange (1997), and calibrated using the work by Lin et al. (2006). The blue points indicate ![]() values from the literature (see text). The error bars provide the standard deviation of the posterior distribution of the parameters
values from the literature (see text). The error bars provide the standard deviation of the posterior distribution of the parameters ![]() , but we stress that the distributions are generally non gaussian and non symmetric (see Ricci et al. 2018, for a detailed discussion on this topic).
, but we stress that the distributions are generally non gaussian and non symmetric (see Ricci et al. 2018, for a detailed discussion on this topic).
Current usage metrics show cumulative count of Article Views (full-text article views including HTML views, PDF and ePub downloads, according to the available data) and Abstracts Views on Vision4Press platform.
Data correspond to usage on the plateform after 2015. The current usage metrics is available 48-96 hours after online publication and is updated daily on week days.
Initial download of the metrics may take a while.