Fig. 4.
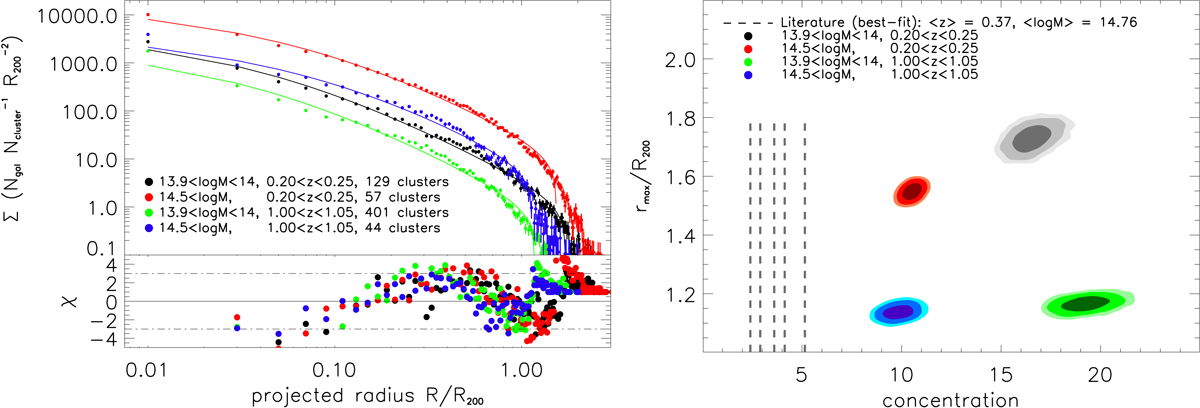
Left: stacked surface density (projected) profile of cluster galaxies. The different colors indicate different mass and redshift bins, as indicated in the legend. The solid lines provide the best-fit models of Eq. (2) in each case. The residual normalized by the error, χ, is also provided. Right: posterior likelihood on the model truncation radius parameters rmax and concentration c for each bin, providing the 68%, 95% and 99% C.L. The vertical dashed lines represent the best-fit number concentration cluster observational data from the literature, namely: c = 2.90 ± 0.22 (at a median redshift med(z)=0.04, and median mass med(M200)=4 × 10¹⁴ M⊙, Lin et al. 2004), c = 4.13 ± 0.57 (at med(z)=0.31, med(M200)=3 × 10¹⁴ M⊙, Muzzin et al. 2007), ![]() (at med(z)=1.00, med(M200)=2 × 10¹⁴ M⊙, van der Burg et al. 2014), 1/c = 0.278 ± 0.065 (at med(z)=0.06, med(M200)=6 × 10¹⁴ M⊙, van der Burg et al. 2014), c = 2.40 ± 0.30 (at med(z)=0.44, med(M200)=14 × 1014 M⊙, Annunziatella et al. 2014).
(at med(z)=1.00, med(M200)=2 × 10¹⁴ M⊙, van der Burg et al. 2014), 1/c = 0.278 ± 0.065 (at med(z)=0.06, med(M200)=6 × 10¹⁴ M⊙, van der Burg et al. 2014), c = 2.40 ± 0.30 (at med(z)=0.44, med(M200)=14 × 1014 M⊙, Annunziatella et al. 2014).
Current usage metrics show cumulative count of Article Views (full-text article views including HTML views, PDF and ePub downloads, according to the available data) and Abstracts Views on Vision4Press platform.
Data correspond to usage on the plateform after 2015. The current usage metrics is available 48-96 hours after online publication and is updated daily on week days.
Initial download of the metrics may take a while.