Fig. 2.
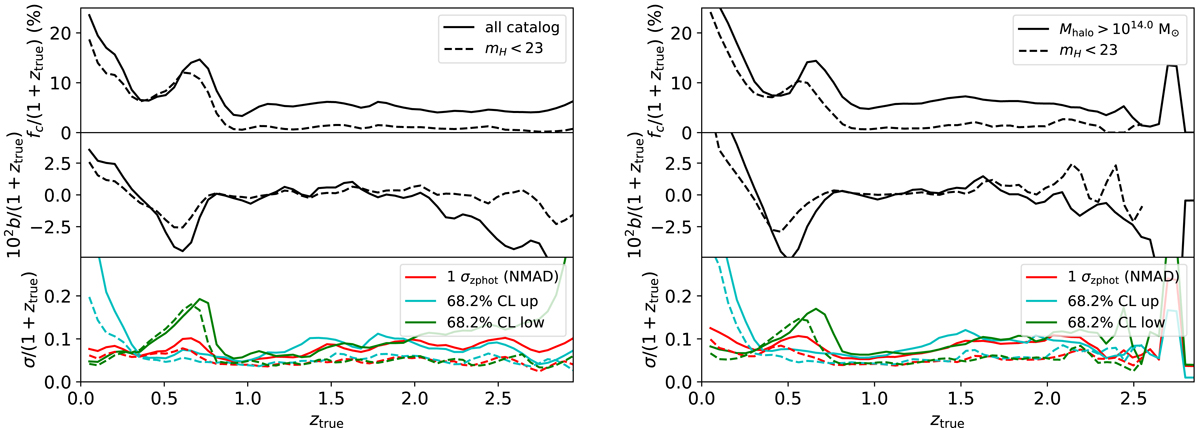
Redshift evolution of the catastrophic outlier fraction (fc, upper panel), the bias (b, middle panel), and different estimates of the dispersions (σ, lower panel) as a function of spectroscopic redshift. The solid lines correspond to the full catalog, while the dashed lines correspond to the catalog once objects fainter than magnitude mH = 23 are removed. Upper and lower values of the dispersion computed using percentiles with respect to the de-biased distributions are shown according to the legend. Left panel: distributions for the field plus cluster member galaxies and right panel: cluster member galaxies, i.e., those within haloes more massive than 1014 M⊙.
Current usage metrics show cumulative count of Article Views (full-text article views including HTML views, PDF and ePub downloads, according to the available data) and Abstracts Views on Vision4Press platform.
Data correspond to usage on the plateform after 2015. The current usage metrics is available 48-96 hours after online publication and is updated daily on week days.
Initial download of the metrics may take a while.