Fig. 17.
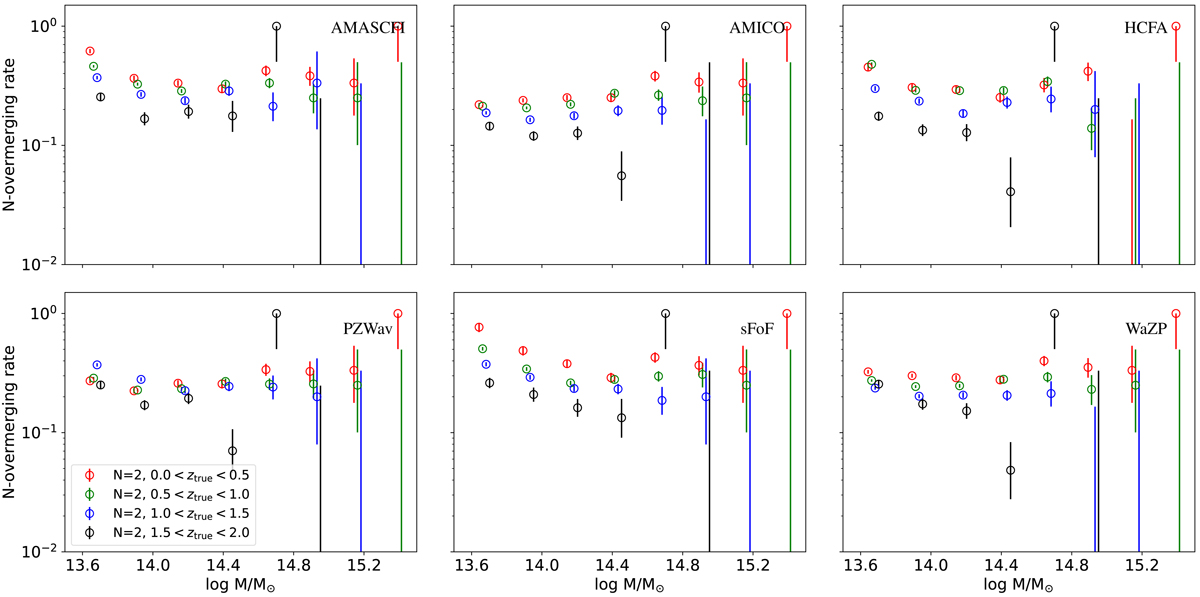
Fraction of overmerged detected clusters (two or more mock clusters associated with a detection), as a function of mass, for different redshift bins, for six detection algorithms. Error bars are computed as in Fig. 11. Each catalog of detections has been trimmed to the most reliable detections insuring a mean purity of 80% in the range M > 1014 M⊙ and ztrue < 2.
Current usage metrics show cumulative count of Article Views (full-text article views including HTML views, PDF and ePub downloads, according to the available data) and Abstracts Views on Vision4Press platform.
Data correspond to usage on the plateform after 2015. The current usage metrics is available 48-96 hours after online publication and is updated daily on week days.
Initial download of the metrics may take a while.