Fig. 9.
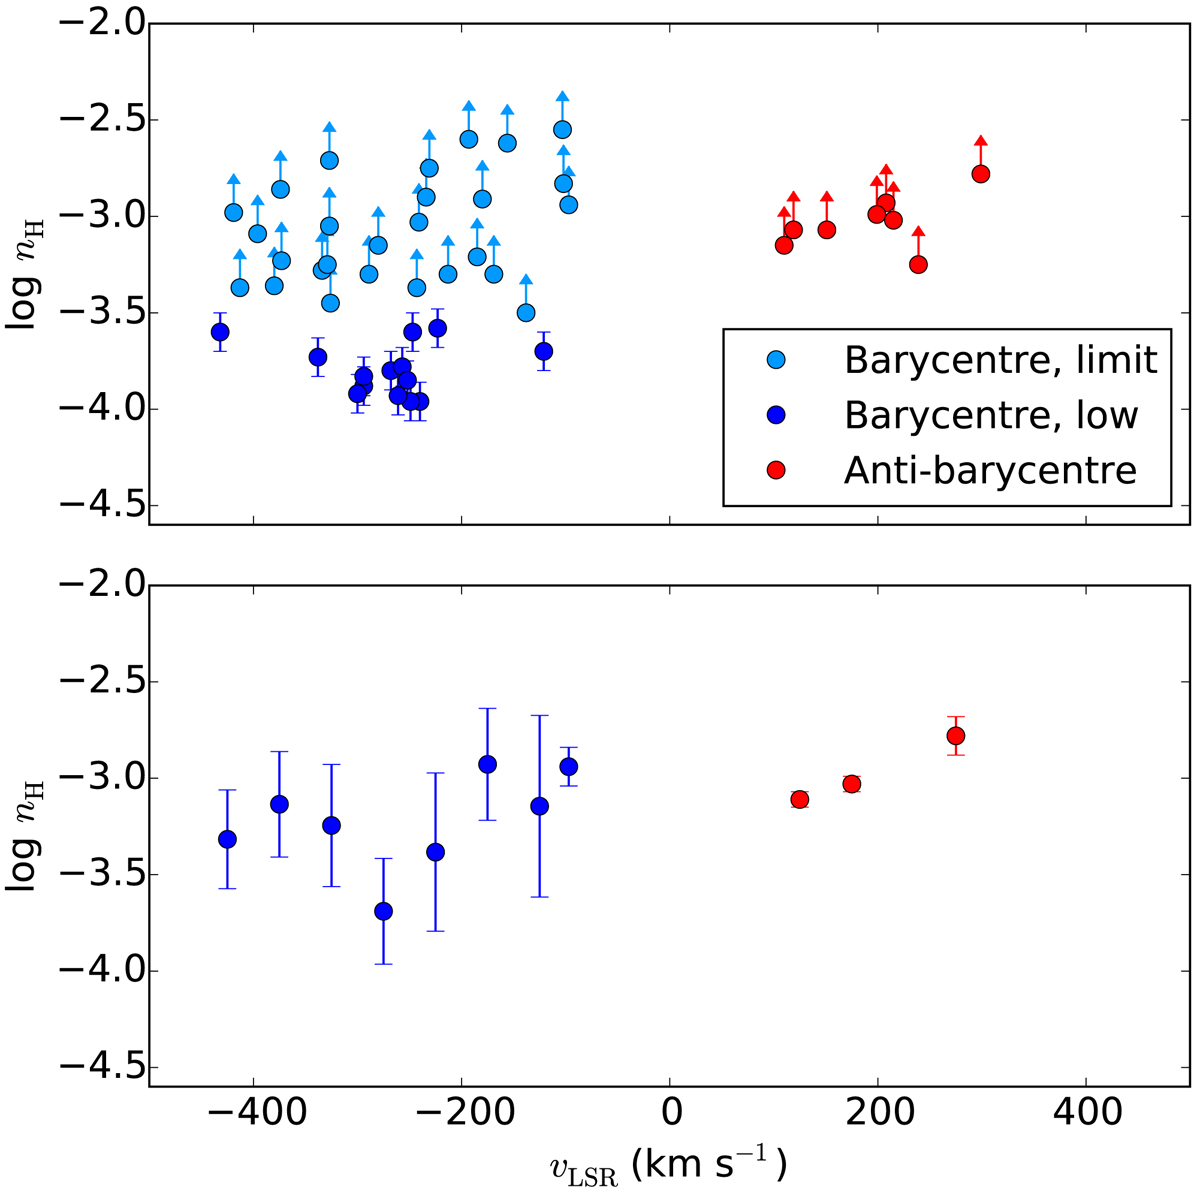
Volume density of hydrogen plotted against vLSR for our HVC absorber sample. The blue data points show the barycentre absorbers, the red data points indicate the anti-barycentre absorbers. The densities are taken from our Cloudy modelling. Upper panel: data points for the 49 HVCs with reliable nH measurements are shown. Lower limits are indicated by light blue symbols and indicated by the arrow. HVCs with log nH ≤ −3.54 are shown in dark blue. Lower panel: same as above, but data are binned in 50 km s−1-wide velocity bins. For this plot, we regard the individual densities as fixed values (i.e. in this plot we ignore that densities may represent lower limits).
Current usage metrics show cumulative count of Article Views (full-text article views including HTML views, PDF and ePub downloads, according to the available data) and Abstracts Views on Vision4Press platform.
Data correspond to usage on the plateform after 2015. The current usage metrics is available 48-96 hours after online publication and is updated daily on week days.
Initial download of the metrics may take a while.