Fig. 8.
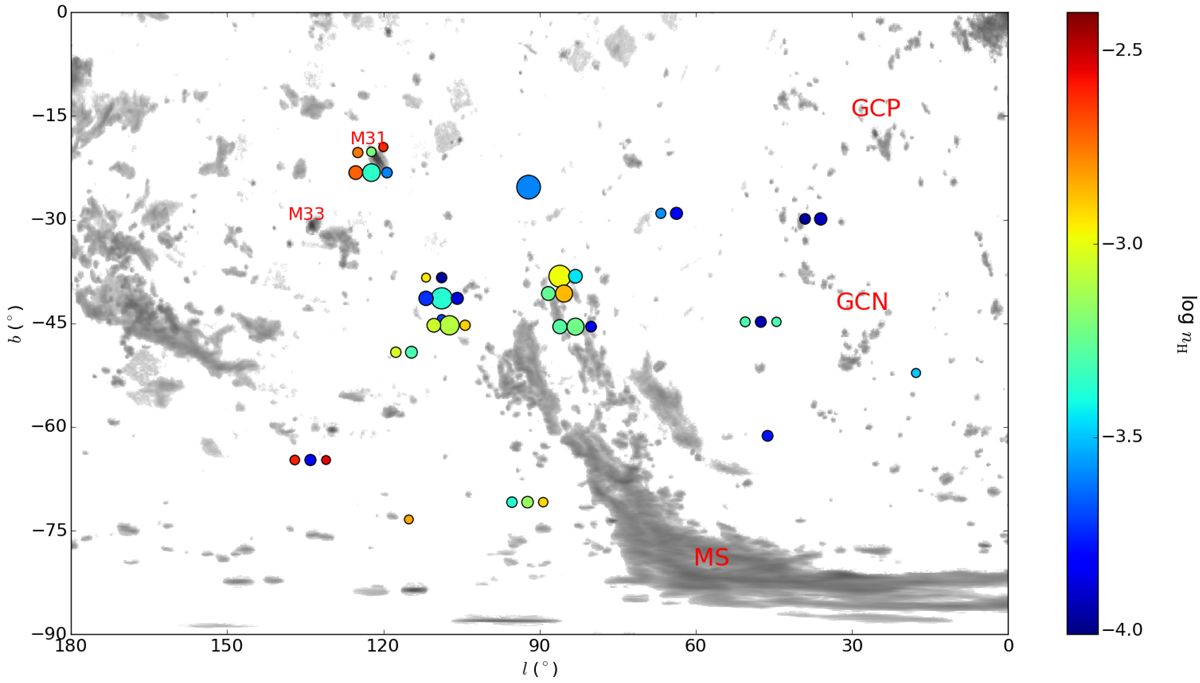
Sky-distribution of gas densities (see vertical bar at right for colour-coding) for 41 HVCs in the barycentre direction with log nH measured from Si III, overlaid on the H I map with data from Westmeier (2018), which is based on the LAB survey (Kalberla et al. 2005, 2007). For purposes of display, HVCs along the same sightlines have been given an angular offset. The size of the dots scales with the HVC velocity. Important H I complexes are indicated.
Current usage metrics show cumulative count of Article Views (full-text article views including HTML views, PDF and ePub downloads, according to the available data) and Abstracts Views on Vision4Press platform.
Data correspond to usage on the plateform after 2015. The current usage metrics is available 48-96 hours after online publication and is updated daily on week days.
Initial download of the metrics may take a while.